[1]:
%config InlineBackend.figure_formats = ['png']
%matplotlib inline
Matplotlib is building the font cache; this may take a moment.
[2]:
import warnings

warnings.filterwarnings('ignore')
import os
Overview of Functionality
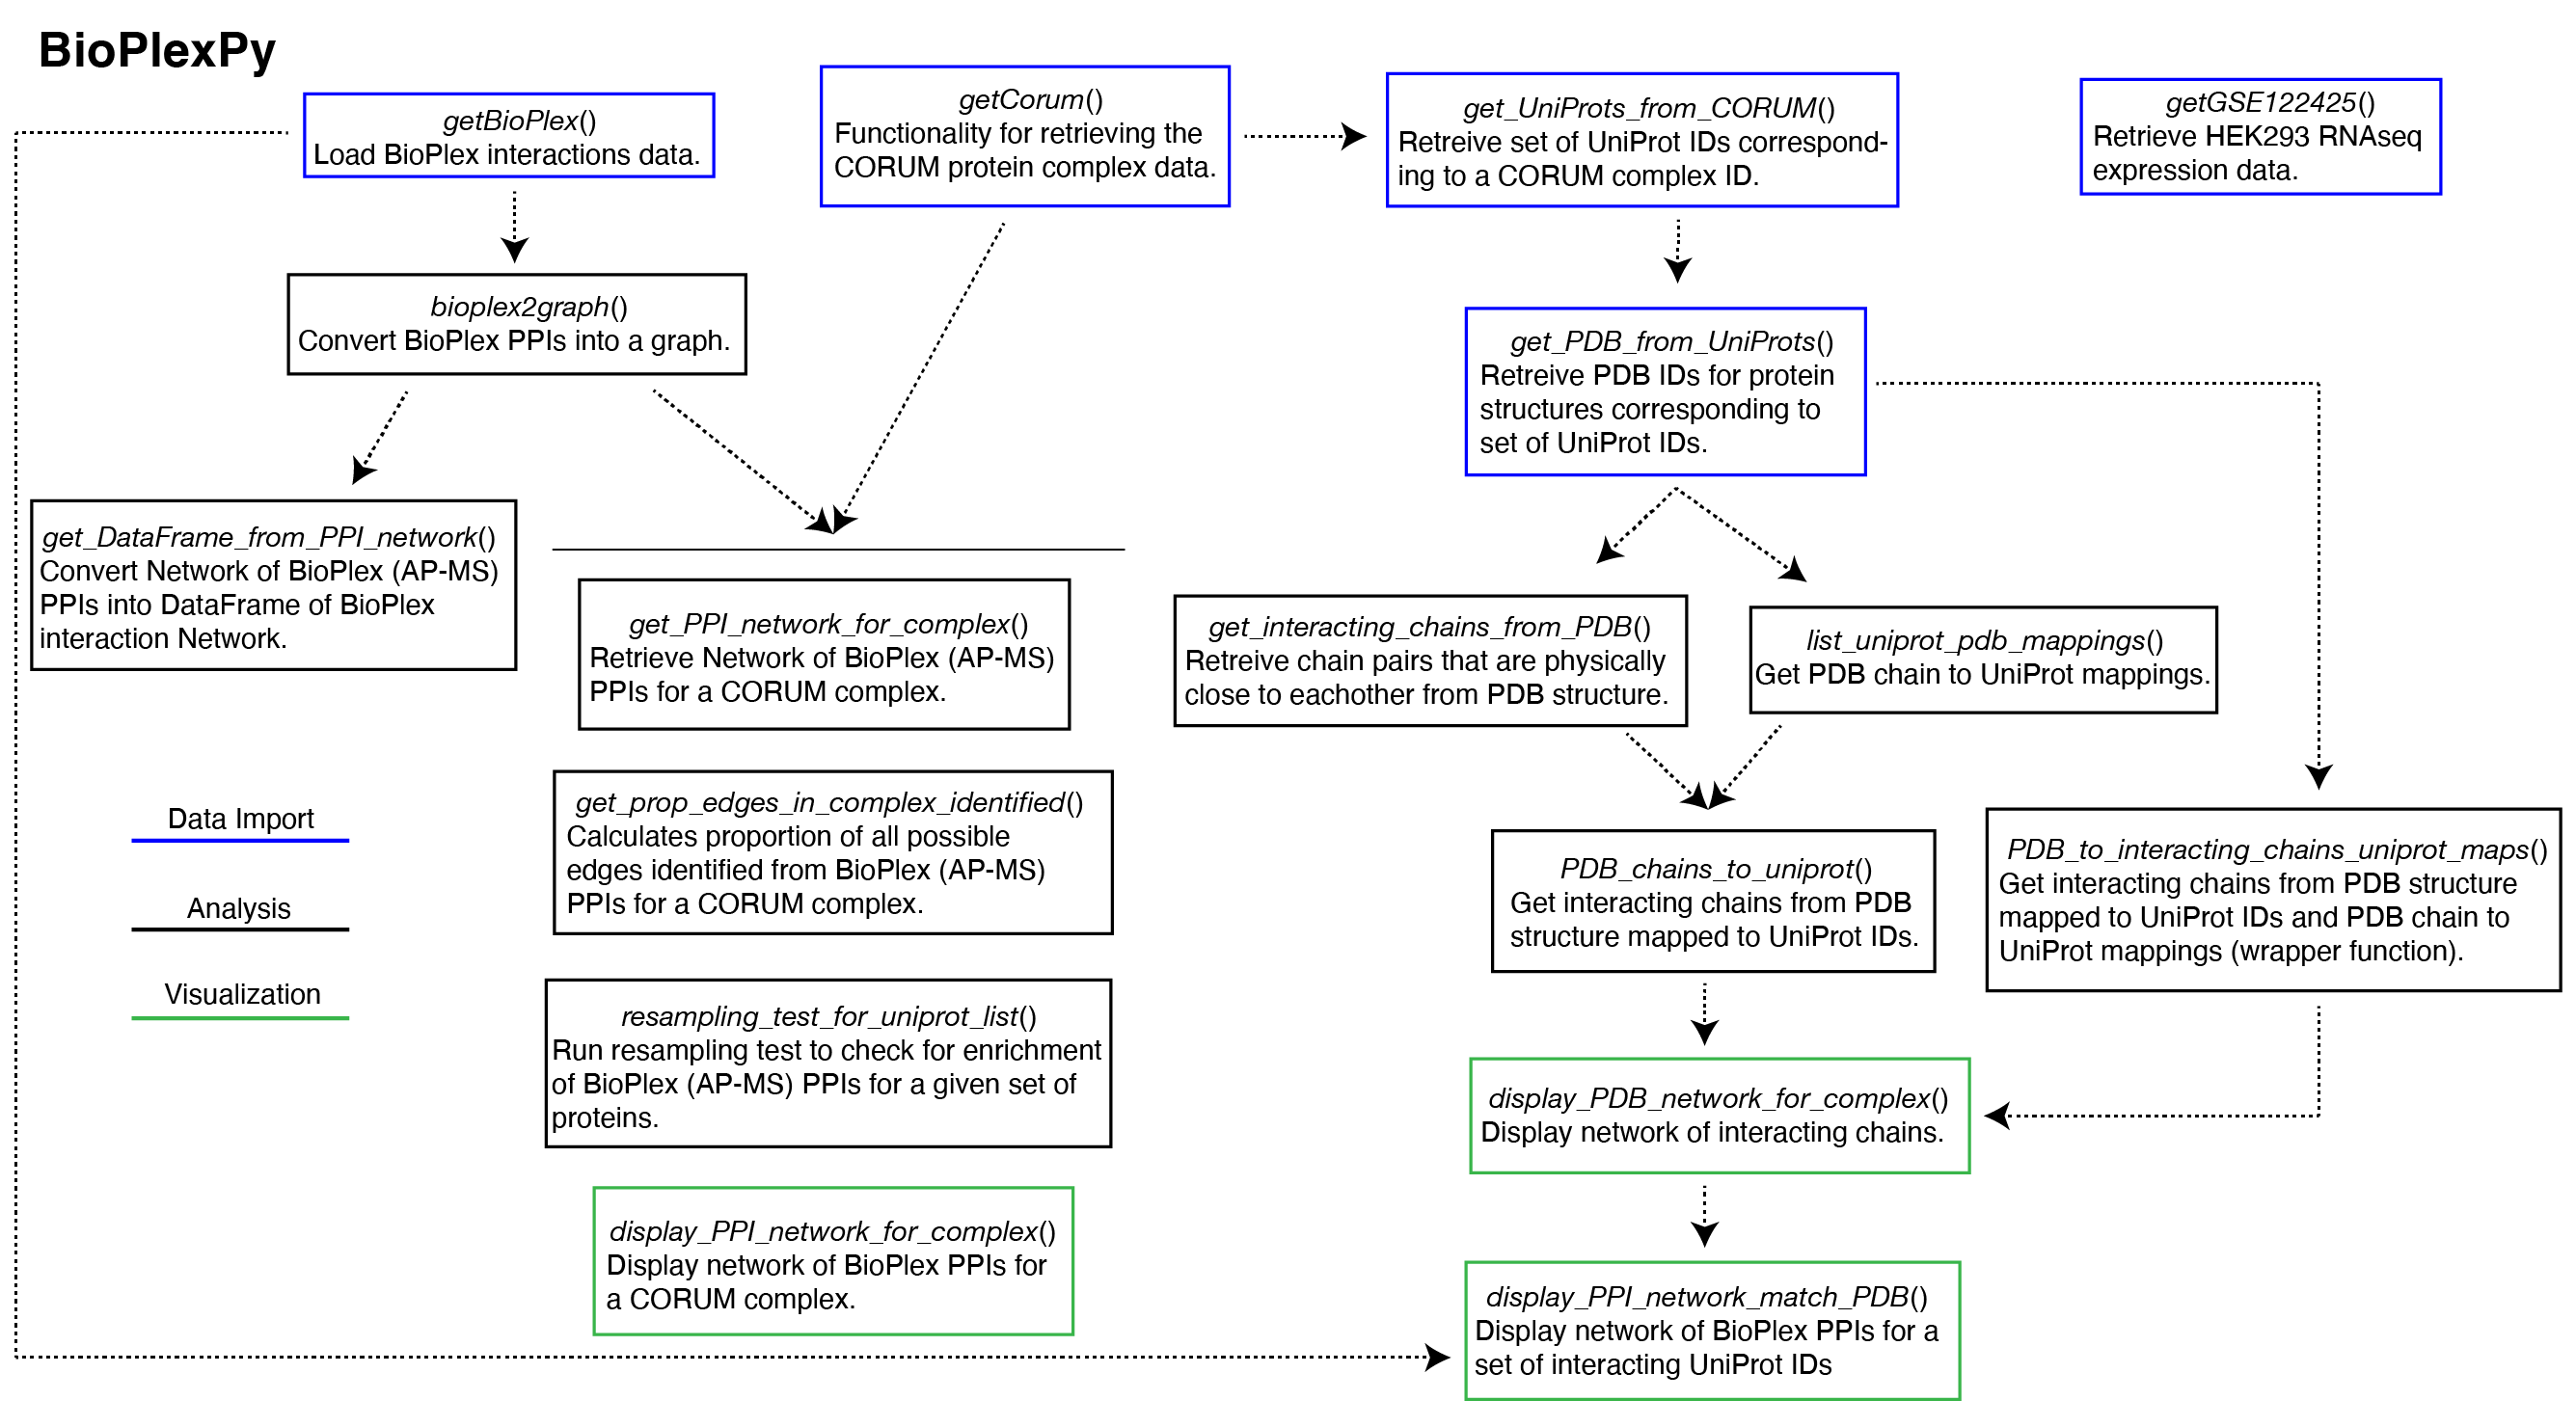
Examples for how to use functions from bioplexpy
use cell magic to move up to parent directory
[3]:
cd ..
/home/docs/checkouts/readthedocs.org/user_builds/bioplexpy/checkouts/v1.1.1
Import functions from modules
[4]:
# data import funcs
# analysis funcs
from bioplexpy.analysis_funcs import (
    PDB_chains_to_uniprot,
    PDB_to_interacting_chains_uniprot_maps,
    bioplex2graph,
    get_DataFrame_from_PPI_network,
    get_interacting_chains_from_PDB,
    get_PPI_network_for_complex,
    get_prop_edges_in_complex_identified,
    list_uniprot_pdb_mappings,
    resampling_test_for_uniprot_list,
)
from bioplexpy.data_import_funcs import (
    get_PDB_from_UniProts,
    get_UniProts_from_CORUM,
    getBioPlex,
    getCorum,
    getGSE122425,
)

# visualization funcs
from bioplexpy.visualization_funcs import (
    display_PDB_network_for_complex,
    display_PPI_network_for_complex,
    display_PPI_network_match_PDB,
)
[1] getBioPlex - function to retrieve interactions data
Description
Load BioPlex interactions data - This function loads BioPlex PPI data for cell lines HEK293T and HCT116, note we only have version 1.0 for HCT116 cells.
Parameters
cell_line : str
Takes input: ‘293T’ or ‘HCT116’
version : str
Takes input: ‘3.0’, ‘1.0’ or ‘2.0’
Returns
Pandas DataFrame
A dataframe with each row corresponding to a PPI interaction.
Column Descriptions
GeneA: Entrez Gene ID for the first interacting protein
GeneB: Entrez Gene ID for the second interacting protein
UniprotA: Uniprot ID for the first interacting protein
UniprotB: Uniprot ID for the second interacting protein
SymbolA: Symbol for the first interacting protein
SymbolB: Symbol for the second interacting protein
p(Wrong ID): Probability of wrong protein ID (CompPASS-Plus)
p(NotInteractor): Probability of nonspecific background (CompPASS-Plus)
p(Interactor): Probability of high-confidence interaction (CompPASS-Plus)
Example 1
Load DataFrames that contain protein-protein interactions from HEK293T & HCT116 cell lines
[5]:
bp_293t = getBioPlex('293T', '3.0')
[6]:
bp_293t.head()
[6]:
| GeneA | GeneB | UniprotA | UniprotB | SymbolA | SymbolB | pW | pNI | pInt | |
|---|---|---|---|---|---|---|---|---|---|
| 0 | 100 | 728378 | P00813 | A5A3E0 | ADA | POTEF | 6.881844e-10 | 0.000118 | 0.999882 |
| 1 | 222389 | 6137 | Q8N7W2-2 | P26373 | BEND7 | RPL13 | 1.340380e-18 | 0.225664 | 0.774336 |
| 2 | 222389 | 5928 | Q8N7W2-2 | Q09028-3 | BEND7 | RBBP4 | 7.221401e-21 | 0.000064 | 0.999936 |
| 3 | 222389 | 25873 | Q8N7W2-2 | Q9Y3U8 | BEND7 | RPL36 | 7.058372e-17 | 0.128183 | 0.871817 |
| 4 | 222389 | 6124 | Q8N7W2-2 | P36578 | BEND7 | RPL4 | 1.632313e-22 | 0.200638 | 0.799362 |
Example 2
[7]:
bp_hct116 = getBioPlex('HCT116', '1.0')
[8]:
bp_hct116.head()
[8]:
| GeneA | GeneB | UniprotA | UniprotB | SymbolA | SymbolB | pW | pNI | pInt | |
|---|---|---|---|---|---|---|---|---|---|
| 0 | 88455 | 50649 | Q8IZ07 | Q9NR80-4 | ANKRD13A | ARHGEF4 | 3.959215e-04 | 0.000033 | 0.999571 |
| 1 | 88455 | 115106 | Q8IZ07 | Q96CS2 | ANKRD13A | HAUS1 | 4.488473e-02 | 0.001935 | 0.953181 |
| 2 | 88455 | 23086 | Q8IZ07 | Q8NEV8-2 | ANKRD13A | EXPH5 | 7.402394e-05 | 0.000930 | 0.998996 |
| 3 | 88455 | 54930 | Q8IZ07 | Q9H6D7 | ANKRD13A | HAUS4 | 9.180959e-07 | 0.000128 | 0.999871 |
| 4 | 88455 | 79441 | Q8IZ07 | Q68CZ6 | ANKRD13A | HAUS3 | 8.709394e-07 | 0.001495 | 0.998504 |
[2] getGSE122425 - function to retrieve HEK293 RNAseq expression data
Description
Retrieve HEK293 RNAseq expression data.
Returns
adata : AnnData object
SummarizedExperiment of HEK293 raw count with an added layer storing rpkm.
Example 1
Load AnnData structure that has mRNA profiles (RNA-seq) of wild type (WT) and NSUN2-/- HEK293 cells that were generated by deep sequencing, in triplicate.
[9]:
HEK293_adata = getGSE122425()
[10]:
HEK293_adata
[10]:
AnnData object with n_obs × n_vars = 57905 × 6
    obs: 'SYMBOL', 'KO', 'GO', 'length'
    layers: 'rpkm'
List rows (observations) that specify genes
[11]:
print(HEK293_adata.obs_names[:10].tolist())
['ENSG00000223972', 'ENSG00000227232', 'ENSG00000243485', 'ENSG00000237613', 'ENSG00000268020', 'ENSG00000240361', 'ENSG00000186092', 'ENSG00000238009', 'ENSG00000239945', 'ENSG00000233750']
List columns (variables) that specify whether at knock-out or wildtype replicates
[12]:
print(HEK293_adata.var_names.tolist())
['NK.1', 'NK.2', 'NK.3', 'WT.1', 'WT.2', 'WT.3']
Call matrix with raw counts
[13]:
print(HEK293_adata.X)
[[   0    0    2    1    2    2]
 [ 705  812 1121  732  690  804]
 [   0    0    0    0    0    2]
 ...
 [   0    0    0    0    0    0]
 [   0    0    0    0    0    0]
 [   0    0    0    0    0    0]]
Call matrix with rpkm
[14]:
print(HEK293_adata.layers["rpkm"])
[[0.   0.   0.01 0.01 0.01 0.01]
 [4.77 5.21 6.8  5.43 5.07 5.39]
 [0.   0.   0.   0.   0.   0.04]
 ...
 [0.   0.   0.   0.   0.   0.  ]
 [0.   0.   0.   0.   0.   0.  ]
 [0.   0.   0.   0.   0.   0.  ]]
[3] bioplex2graph - function to convert BioPlex PPIs into a graph data structure
Description
Convert BioPlex PPIs into a graph - This function converts representation of BioPlex PPIs into a graph data structure representation of BioPlex PPIs in a NetworkX object from NetworkX.
Parameters
DataFrame of PPIs : Pandas DataFrame
Returns
NetworkX graph
A NetworkX graph with Nodes = Uniprot Gene Symbols and Edges = interactions.
Example 1
Obtain the latest version of the 293T PPI network
[15]:
bp_293t_df = getBioPlex('293T', '3.0')
[16]:
bp_293t_df.head()
[16]:
| GeneA | GeneB | UniprotA | UniprotB | SymbolA | SymbolB | pW | pNI | pInt | |
|---|---|---|---|---|---|---|---|---|---|
| 0 | 100 | 728378 | P00813 | A5A3E0 | ADA | POTEF | 6.881844e-10 | 0.000118 | 0.999882 |
| 1 | 222389 | 6137 | Q8N7W2-2 | P26373 | BEND7 | RPL13 | 1.340380e-18 | 0.225664 | 0.774336 |
| 2 | 222389 | 5928 | Q8N7W2-2 | Q09028-3 | BEND7 | RBBP4 | 7.221401e-21 | 0.000064 | 0.999936 |
| 3 | 222389 | 25873 | Q8N7W2-2 | Q9Y3U8 | BEND7 | RPL36 | 7.058372e-17 | 0.128183 | 0.871817 |
| 4 | 222389 | 6124 | Q8N7W2-2 | P36578 | BEND7 | RPL4 | 1.632313e-22 | 0.200638 | 0.799362 |
Turn the data into a graph with NetworkX
[17]:
bp_293t_G = bioplex2graph(bp_293t_df)
Example 2 - Examine properties of Network
Analyze nodes in PPI network
[18]:
len(bp_293t_G.nodes()) # number of nodes
[18]:
13689
[19]:
list(bp_293t_G.nodes())[0:5]
[19]:
['P00813', 'A5A3E0', 'Q8N7W2', 'P26373', 'Q09028']
Call nodes and attributes stored for each node
[20]:
bp_293t_G.nodes['P00813']
[20]:
{'entrezid': 100, 'symbol': 'ADA', 'isoform': 'P00813', 'bait': True}
[21]:
bp_293t_G.nodes['Q8N7W2']
[21]:
{'entrezid': 222389, 'symbol': 'BEND7', 'isoform': 'Q8N7W2-2', 'bait': True}
Analyze edges in PPI network
[22]:
len(bp_293t_G.edges()) # number of edges
[22]:
115868
[23]:
list(bp_293t_G.edges())[0:5]
[23]:
[('P00813', 'A5A3E0'),
 ('Q8N7W2', 'P26373'),
 ('Q8N7W2', 'Q09028'),
 ('Q8N7W2', 'Q9Y3U8'),
 ('Q8N7W2', 'P36578')]
Call edges and attributes stored for each edge (PPI)
[24]:
bp_293t_G.get_edge_data('P00813', 'A5A3E0')
[24]:
{'pW': 6.88184379952655e-10,
 'pNI': 0.000117635665707,
 'pInt': 0.999882363646109}
Example 3 - Run network algorithms using NetworkX
[25]:
import networkx as nx
import pandas as pd
Run pagerank algorithm on network and rank nodes
[26]:
bp_293t_G_pr = nx.pagerank(bp_293t_G, alpha=0.8)
bp_293t_G_pr = pd.Series(bp_293t_G_pr)
bp_293t_G_pr.sort_values(ascending = False, inplace = True)
[27]:
bp_293t_G_pr.head(n=5)
[27]:
P11142    0.002610
P11021    0.002168
Q04917    0.001840
O14556    0.001527
P0CG47    0.001471
dtype: float64
[4] getCorum - function to retrieve CORUM complex data
Description
Functionality for retrieving the CORUM protein complex data.
Parameters
complex_set : str
Maps to CORUM files:
‘all’ -> corum_allComplexes.txt, (default ‘all’).
‘drug’ -> corum_drugs.txt,
‘splice’ -> corum_spliceComplexes.txt,
‘partial’ -> corum_partialComplexes.txt.
organism : str
Takes input ‘Bovine’,’Dog’,’Hamster’,’Human’,’MINK’,’Mammalia’,’Mouse’,’Pig’,’Rabbit’,’Rat’ (default ‘Human’).
Returns
Pandas DataFrame
A dataframe with each row corresponding to a CORUM complex.
Example 1
Retrieve all CORUM complexes for Human
[28]:
all_Human_CORUM_df = getCorum()
[29]:
all_Human_CORUM_df.head(n=3)
[29]:
| complex_id | complex_name | synonyms | organism | cell_line | pmid | comment_complex | comment_members | comment_disease | comment_drug | ... | functions_go_name | functions_go_ontology | fcgs_description | fcgs_id | fcgs_name | fcgs_category_id | fcgs_category_name | fcgs_go_id | fcgs_go_name | fcgs_go_ontology | |
|---|---|---|---|---|---|---|---|---|---|---|---|---|---|---|---|---|---|---|---|---|---|
| 0 | 1 | BCL6-HDAC4 complex | NaN | Human | U2OS osteosarcoma-derived UTA-L cells | 11929873 | Transcriptional repression by BCL6 is thought ... | NaN | NaN | NaN | ... | histone deacetylase activity;nucleus;DNA topol... | molecular_function;cellular_component;biologic... | NaN | NaN | NaN | NaN | NaN | NaN | NaN | NaN |
| 1 | 2 | BCL6-HDAC5 complex | NaN | Human | U2OS osteosarcoma-derived UTA-L cells | 11929873 | Transcriptional repression by BCL6 is thought ... | NaN | NaN | NaN | ... | histone deacetylase activity;nucleus;DNA topol... | molecular_function;cellular_component;biologic... | NaN | NaN | NaN | NaN | NaN | NaN | NaN | NaN |
| 2 | 3 | BCL6-HDAC7 complex | NaN | Human | U2OS osteosarcoma-derived UTA-L cells | 11929873 | Transcriptional repression by BCL6 is thought ... | NaN | NaN | NaN | ... | histone deacetylase activity;nucleus;DNA topol... | molecular_function;cellular_component;biologic... | NaN | NaN | NaN | NaN | NaN | NaN | NaN | NaN |
3 rows × 34 columns
[30]:
all_Human_CORUM_df.shape
[30]:
(5376, 34)
Example 2
Retrieve the core CORUM complexes for Mouse
[31]:
core_Mouse_CORUM_df = getCorum('all','Mouse')
[32]:
core_Mouse_CORUM_df.head(n=3)
[32]:
| complex_id | complex_name | synonyms | organism | cell_line | pmid | comment_complex | comment_members | comment_disease | comment_drug | ... | functions_go_name | functions_go_ontology | fcgs_description | fcgs_id | fcgs_name | fcgs_category_id | fcgs_category_name | fcgs_go_id | fcgs_go_name | fcgs_go_ontology | |
|---|---|---|---|---|---|---|---|---|---|---|---|---|---|---|---|---|---|---|---|---|---|
| 0 | 9 | Ahr-Arnt complex | 6S-nuclear aryl hydrocarbon (Ah) receptor liga... | Mouse | Hepa-1cells | 1317062 | Arnt contains a basic helix-loop-helix motif, ... | NaN | NaN | NaN | ... | DNA binding;nucleus;regulation of DNA-template... | molecular_function;cellular_component;biologic... | NaN | NaN | NaN | NaN | NaN | NaN | NaN | NaN |
| 1 | 14 | BLOC-2 (biogenesis of lysosome-related organel... | NaN | Mouse | liver | 14718540 | The results indicate that the Hps3, Hps5, and ... | NaN | HPS1-7 are involved in Hermansky-Pudlak syndro... | NaN | ... | endosome organization;vacuole organization;lys... | biological_process;biological_process;biologic... | NaN | NaN | NaN | NaN | NaN | NaN | NaN | NaN |
| 2 | 24 | BLOC-1 (biogenesis of lysosome-related organel... | NaN | Mouse | liver | 15102850 | The authors identified Snapin, BLOS1, BLOS2, a... | NaN | PLDN, MUTED, CNO and DTNBP1 are involved in He... | NaN | ... | endosome organization;vacuole organization;lys... | biological_process;biological_process;biologic... | NaN | NaN | NaN | NaN | NaN | NaN | NaN | NaN |
3 rows × 34 columns
[33]:
core_Mouse_CORUM_df.shape
[33]:
(1284, 34)
[5] get_PPI_network_for_complex - that returns matching edges (PPI data) for a given CORUM complex as a sub-graph
Description
This function returns a subgraph of PPIs identified through AP-MS between the proteins in a specified CORUM complex.
Parameters
Network of PPIs : NetworkX graph
DataFrame of CORUM complexes : Pandas DataFrame
Corum Complex ID: int
Returns
NetworkX Graph
A subgraph induced by the proteins in a CORUM complex from the BioPlex network used as input.
Example 1
Obtain the latest version of the 293T PPI network
[34]:
bp_293t_df = getBioPlex('293T', '3.0')
Obtain NetworkX graph representation of 293T PPI network
[35]:
bp_293t_G = bioplex2graph(bp_293t_df)
Obtain core CORUM complexes for Human
[36]:
Corum_DF = getCorum()
Get edges detected via AP-MS for ING2 complex from HEK293T cell line PPI data version 3.0 (ING2 complex ID: 2851)
[37]:
ING2_bp_293t_G = get_PPI_network_for_complex(bp_293t_G, Corum_DF, 2851)
[38]:
len(list(ING2_bp_293t_G.edges))
[38]:
56
Example 2
Get edges detected via AP-MS for BCOR complex from HEK293T cell line PPI data version 3.0 (BCOR complex ID: 1178)
[39]:
BCOR_bp_293t_G = get_PPI_network_for_complex(bp_293t_G, Corum_DF, 1178)
[40]:
len(list(BCOR_bp_293t_G.edges))
[40]:
14
[6] get_DataFrame_from_PPI_network - that takes an AP-MS graph (NetworkX) and returns a dataframe of PPIs (Edges)
Description
This function returns a DataFrame of PPIs (identified through AP-MS) represented as a graph.
Parameters
Network of PPIs : NetworkX graph
Returns
Pandas DataFrame
A DataFrame of edges (AP-MS interactions) from a network.
Example 1
Obtain the latest version of the 293T PPI network
[41]:
bp_293t_df = getBioPlex('293T', '3.0')
Obtain NetworkX graph representation of 293T PPI network
[42]:
bp_293t_G = bioplex2graph(bp_293t_df)
Obtain core CORUM complexes for Human
[43]:
Corum_DF = getCorum()
Get edges detected via AP-MS for ING2 complex from HEK293T cell line PPI data version 3.0 (ING2 complex ID: 2851)
[44]:
ING2_bp_293t_G = get_PPI_network_for_complex(bp_293t_G, Corum_DF, 2851)
Convert ING2 AP-MS network into DataFrame w/ each row corresponding to an edge
[45]:
ING2_bp_293t_df = get_DataFrame_from_PPI_network(ING2_bp_293t_G)
[46]:
ING2_bp_293t_df.head()
[46]:
| UniprotA | UniprotB | SymbolA | SymbolB | pW | pNI | pInt | |
|---|---|---|---|---|---|---|---|
| 0 | Q09028 | O75446 | RBBP4 | SAP30 | 3.703916e-21 | 0.000023 | 0.999977 |
| 1 | Q09028 | Q13547 | RBBP4 | HDAC1 | 5.003673e-30 | 0.000005 | 0.999995 |
| 2 | Q09028 | Q92769 | RBBP4 | HDAC2 | 3.457866e-18 | 0.029766 | 0.970234 |
| 3 | Q09028 | P29374 | RBBP4 | ARID4A | 7.463030e-29 | 0.000013 | 0.999987 |
| 4 | Q09028 | Q16576 | RBBP4 | RBBP7 | 5.123652e-30 | 0.000021 | 0.999979 |
[47]:
ING2_bp_293t_df.shape
[47]:
(56, 7)
Example 2
Get edges detected via AP-MS for BCOR complex from HEK293T cell line PPI data version 3.0 (BCOR complex ID: 1178)
[48]:
BCOR_bp_293t_G = get_PPI_network_for_complex(bp_293t_G, Corum_DF, 1178)
Convert BCOR AP-MS network into DataFrame w/ each row corresponding to an edge
[49]:
BCOR_bp_293t_df = get_DataFrame_from_PPI_network(BCOR_bp_293t_G)
[50]:
BCOR_bp_293t_df.head()
[50]:
| UniprotA | UniprotB | SymbolA | SymbolB | pW | pNI | pInt | |
|---|---|---|---|---|---|---|---|
| 0 | Q9BSM1 | Q8NHM5 | PCGF1 | KDM2B | 3.189895e-09 | 1.691454e-07 | 1.000000 |
| 1 | Q9BSM1 | Q6W2J9 | PCGF1 | BCOR | 1.342302e-14 | 2.582672e-06 | 0.999997 |
| 2 | Q9BSM1 | Q8N488 | PCGF1 | RYBP | 7.760669e-19 | 3.110777e-11 | 1.000000 |
| 3 | Q9BSM1 | Q99496 | PCGF1 | RNF2 | 2.181103e-13 | 3.714136e-03 | 0.996286 |
| 4 | Q9BSM1 | Q06587 | PCGF1 | RING1 | 7.298679e-14 | 3.132373e-04 | 0.999687 |
[51]:
BCOR_bp_293t_df.shape
[51]:
(14, 7)
[7] get_prop_edges_in_complex_identified - function that returns the proportion of interactions between proteins in a CORUM complex detected by AP-MS
Description
This function returns the proportion of all possible PPIs identified through AP-MS between the proteins in a specified CORUM complex.
Parameters
DataFrame of PPIs : Pandas DataFrame
DataFrame of CORUM complexes : Pandas DataFrame
Corum Complex ID: int
Returns
Float
The proportion of interactions between all proteins in CORUM complex identified through AP-MS PPI data.
Example 1
Obtain the latest version of the 293T PPI network
[52]:
bp_293t_df = getBioPlex('293T', '3.0')
Obtain NetworkX graph representation of 293T PPI network
[53]:
bp_293t_G = bioplex2graph(bp_293t_df)
Obtain core CORUM complexes for Human
[54]:
Corum_DF = getCorum()
Get proportion of interactions identified for ING2 complex from HEK293T cell line PPI data version 3.0 (ING2 complex ID: 2851)
[55]:
get_prop_edges_in_complex_identified(bp_293t_G, Corum_DF, 2851)
[55]:
0.718
Example 2
Get proportion of interactions identified for Arp2/3 complex from HEK293T cell line PPI data version 3.0 (Arp2/3 complex ID: 27)
[56]:
get_prop_edges_in_complex_identified(bp_293t_G, Corum_DF, 27)
[56]:
0.667
[8] resampling_test_for_uniprot_list - function that runs resampling test to test whether number of edges for PPI network generated from a given set of proteins is enriched for interactions
Description
This function returns a p-value after running a resampling test by
taking the number of proteins in the specified list of uniprot IDs (N)
choosing N random proteins from the Graph generated by all of the PPI data (G)
calculating the number of edges in the Subgraph (S) induced by N random proteins (with the same proportion of baits (+/- 10%) as the CORUM complex) and storing this value (E_i)
if preserve_node_degree option is invoked, then baits & preys in S must have the same degree distribution as baits & preys in the network generated by given uniprot IDs, respectively,
repeating steps 1-3 num_resamples times to create a null distribution
calculating the number of edges between N proteins in the CORUM complex (E)
returning a p-value by calculating the proportion of values [E_1, E_2, … , E_num_resamples] that are greater than or equal to E.
Parameters
Network of PPIs : NetworkX graph
list of uniprot IDs : list
Number of Resamples: int
option to preserve degree distribution in subgraphs : bool
Returns
Float
A p-value from a resample test to check for enrichment of PPIs detected between proteins in list
Example 1
Obtain the latest version of the 293T PPI network
[57]:
bp_293t_df = getBioPlex('293T', '3.0')
Obtain NetworkX graph representation of 293T PPI network
[58]:
bp_293t_G = bioplex2graph(bp_293t_df)
Obtain core CORUM complexes for Human
[59]:
Corum_DF = getCorum()
Get list of uniprots for Arp2/3 complex
[60]:
UniProts_Arp_2_3 = get_UniProts_from_CORUM(Corum_DF, Complex_ID = 27)
Calculate p-value to check for enrichment of edges in Arp2/3 complex from HEK293T cell line PPI data version 3.0 (Arp2/3 complex ID: 27)
preserve degrees of baits & preys in complex in the randomly sampled subgraphs, note: this option incurs a longer run time. If function call is taking too long to run, try decreasing number of resamples or set preserve_node_degree = False
[61]:
resampling_test_for_uniprot_list(bp_293t_G, UniProts_Arp_2_3, 1000, preserve_node_degree = True)
[61]:
0.000999000999000999
Example 2
Get list of uniprots for ING2 complex
[62]:
UniProts_ING2 = get_UniProts_from_CORUM(Corum_DF, Complex_ID = 2851)
Calculate p-value to check for enrichment of edges in Arp2/3 complex from HEK293T cell line PPI data version 3.0 (Arp2/3 complex ID: 27)
[63]:
resampling_test_for_uniprot_list(bp_293t_G, UniProts_ING2, 1000)
[63]:
0.000999000999000999
Example 3 - iterate through all CORUM complexes and run resampling test on each one using PPI 293T v3 data
[64]:
import matplotlib.pyplot as plt
import numpy as np
import pandas as pd
For each CORUM complex tested:
complex has \(\ge 3\) genes in it
check that at least one of the genes in complex was targeted as a bait
check to see that CORUM complex has at least 1 edge detected in PPI data
Note: resampling test “lags” when the proportion of baits for a CORUM complex < 10%, more resampling of random sub-graphs that don’t satisfy that low number of baits get discarded from p-value calculation
[65]:
Corum_DF.head(n=2)
[65]:
| complex_id | complex_name | synonyms | organism | cell_line | pmid | comment_complex | comment_members | comment_disease | comment_drug | ... | functions_go_name | functions_go_ontology | fcgs_description | fcgs_id | fcgs_name | fcgs_category_id | fcgs_category_name | fcgs_go_id | fcgs_go_name | fcgs_go_ontology | |
|---|---|---|---|---|---|---|---|---|---|---|---|---|---|---|---|---|---|---|---|---|---|
| 0 | 1 | BCL6-HDAC4 complex | NaN | Human | U2OS osteosarcoma-derived UTA-L cells | 11929873 | Transcriptional repression by BCL6 is thought ... | NaN | NaN | NaN | ... | histone deacetylase activity;nucleus;DNA topol... | molecular_function;cellular_component;biologic... | NaN | NaN | NaN | NaN | NaN | NaN | NaN | NaN |
| 1 | 2 | BCL6-HDAC5 complex | NaN | Human | U2OS osteosarcoma-derived UTA-L cells | 11929873 | Transcriptional repression by BCL6 is thought ... | NaN | NaN | NaN | ... | histone deacetylase activity;nucleus;DNA topol... | molecular_function;cellular_component;biologic... | NaN | NaN | NaN | NaN | NaN | NaN | NaN | NaN |
2 rows × 34 columns
[66]:
Corum_DF.shape
[66]:
(5376, 34)
[3.1]
Running this for every complex takes a couple minutes to run, to speed up RunTime we’ll set {num_resamples} = 1000
[67]:
resampling_pvals_CORUM_complex_dict = {}

# get set of baits
bp_i_baits = set(bp_293t_df.UniprotA)

count_i = 0
for CORUM_complex_ID in Corum_DF.complex_id:

    # check to see if CORUM complex has >= 3 genes in it
    genes_in_complex_i = get_UniProts_from_CORUM(Corum_DF, Complex_ID = CORUM_complex_ID)
    if len(genes_in_complex_i) >= 3:

        # check to see that at least one of the genes was targeted as a bait
        genes_as_baits_bool = np.array([gene_i in bp_i_baits for gene_i in genes_in_complex_i])
        if np.sum(genes_as_baits_bool) >= 1:

            # check to see that CORUM complex has at least 1 edge
            CORUM_complex_G = get_PPI_network_for_complex(bp_293t_G, Corum_DF, CORUM_complex_ID)
            if len(list(CORUM_complex_G.edges)) >= 1:

                resampling_pvals_CORUM_complex_dict[CORUM_complex_ID] = resampling_test_for_uniprot_list(bp_293t_G, genes_in_complex_i, 100)

    count_i += 1
    if count_i % 1000 == 0:
        print(count_i)

resampling_pvals_CORUM_complex_series = pd.Series(resampling_pvals_CORUM_complex_dict)
1000
2000
3000
4000
5000
[68]:
len(resampling_pvals_CORUM_complex_series) # number of CORUM complexes actually tested
[68]:
1417
[69]:
plt.style.use('ggplot')
plt.rcParams['lines.linewidth']=1.0
plt.rcParams['axes.facecolor']='1.0'
plt.rcParams['xtick.color']='black'
plt.rcParams['axes.grid']=False
plt.rcParams['axes.edgecolor']='black'
plt.rcParams['grid.color']= '1.0'
plt.rcParams.update({'font.size': 14})

fig, ax = plt.subplots()

ax.hist(resampling_pvals_CORUM_complex_series, bins = 40, rwidth = 0.85, color = 'black')
ax.set_yscale('log')

ax.set_title('Distribution of p-vals from resampling test on every CORUM\nHuman core complex w/ 293T v3 BioPlex interaction data ', fontsize = 12, color = 'k', pad = -15)
ax.set_ylabel(f'Number of CORUM complexes\n(N={len(resampling_pvals_CORUM_complex_series)})', fontsize = 12, color = 'k', labelpad = 1)
ax.set_xlabel('p-val from resampling test' , fontsize = 12, color = 'k', labelpad = 1)

ax.spines['right'].set_visible(False)
ax.spines['top'].set_visible(False)
ax.grid(False)
ax.tick_params(labelcolor = 'k')
ax.tick_params(axis='y', which='major', labelsize=12 , labelcolor = 'k')
ax.tick_params(axis='x', which='major', labelsize=12 , labelcolor = 'k')

fig = plt.gcf()
fig.set_size_inches(7.5, 4.5)
fig.tight_layout()

plt.show()

[70]:
resampling_pvals_CORUM_complex_series.sort_values(ascending = True, inplace = True)
resampling_pvals_CORUM_complex_series.head()
[70]:
6884    0.009901
6903    0.009901
6902    0.009901
6901    0.009901
6900    0.009901
dtype: float64
[71]:
resampling_pvals_CORUM_complex_series.tail(n=15)
[71]:
777      0.039604
9975     0.039604
6194     0.039604
5177     0.039604
2875     0.039604
3137     0.039604
245      0.049505
1625     0.049505
10781    0.049505
8911     0.059406
49       0.059406
1624     0.059406
7557     0.079208
5613     0.128713
5615     0.178218
dtype: float64
Example 4 - differential enrichment between PPI networks
Run resampling test on some of the same complexes for BioPlex HEK293T v1, v2 & v3 PPI networks
[72]:
# 293T v1 PPI network
bp_293t_v1_df = getBioPlex('293T', '1.0')
bp_293t_v1_G = bioplex2graph(bp_293t_v1_df)

# 293T v2 PPI network
bp_293t_v2_df = getBioPlex('293T', '2.0')
bp_293t_v2_G = bioplex2graph(bp_293t_v2_df)

# 293T v3 PPI network
bp_293t_v3_df = getBioPlex('293T', '3.0')
bp_293t_v3_G = bioplex2graph(bp_293t_v3_df)
Arp2/3 complex from HEK293T cell line PPI data version 1.0, 2.0 & 3.0 (Arp2/3 complex ID: 27)
[73]:
UniProts_Arp_2_3 = get_UniProts_from_CORUM(Corum_DF, Complex_ID = 27)
[74]:
resampling_test_for_uniprot_list(bp_293t_v1_G, UniProts_Arp_2_3, 1000)
[74]:
0.000999000999000999
[75]:
resampling_test_for_uniprot_list(bp_293t_v2_G, UniProts_Arp_2_3, 1000)
[75]:
0.000999000999000999
[76]:
resampling_test_for_uniprot_list(bp_293t_v3_G, UniProts_Arp_2_3, 1000)
[76]:
0.000999000999000999
ING2 complex from HEK293T cell line PPI data version 1.0, 2.0 & 3.0 (ING2 complex ID: 2851)
[77]:
UniProts_ING2 = get_UniProts_from_CORUM(Corum_DF, Complex_ID = 2851)
[78]:
resampling_test_for_uniprot_list(bp_293t_v1_G, UniProts_ING2, 1000)
[78]:
0.000999000999000999
[79]:
resampling_test_for_uniprot_list(bp_293t_v2_G, UniProts_ING2, 1000)
[79]:
0.000999000999000999
[80]:
resampling_test_for_uniprot_list(bp_293t_v3_G, UniProts_ING2, 1000)
[80]:
0.000999000999000999
CASP8-FADD-MALT1-BCL10 complex from HEK293T cell line PPI data version 1.0, 2.0 & 3.0 (CASP8-FADD-MALT1-BCL10 complex ID: 2054)
*NOTE: V1 and V2 should fail, added in V3
[81]:
UniProts_list = get_UniProts_from_CORUM(Corum_DF, Complex_ID = 2054)
[82]:
resampling_test_for_uniprot_list(bp_293t_v1_G, UniProts_list, 1000)
ERROR: no edges detected in PPI data for this protein list, p-value could not be computed.
[83]:
resampling_test_for_uniprot_list(bp_293t_v2_G, UniProts_list, 1000)
ERROR: no edges detected in PPI data for this protein list, p-value could not be computed.
[84]:
resampling_test_for_uniprot_list(bp_293t_v3_G, UniProts_list, 1000)
[84]:
0.007992007992007992
[9] display_PPI_network_for_complex - function to visualize PPI data for a given complex from CORUM
Description
Display network of BioPlex PPIs for a CORUM complex - This function displays a complete network in which nodes represent the proteins in a specified CORUM complex and edges represent BioPlex PPIs using NetworkX. Edges detected through AP-MS are colored darker.
Parameters
ax object to draw on: Matplotlib Axes
DataFrame of PPIs : Pandas DataFrame
DataFrame of CORUM complexes : Pandas DataFrame
Corum Complex ID: int
Size of Nodes in Network: int
Width of Edges in Network: float
optional Size of font for Node Labels: int
optional Color of Nodes targeted as baits: str
optional Color of Nodes detected as preys only: str
optional Color of Edges observed via AP-MS from PPI data: str
optional NetworkX Position of Nodes: dict
Returns
Node Positions
Dictionary of Node Positions in NetworkX layout.
Example 1
[85]:
import matplotlib.pyplot as plt
Obtain the latest version of the 293T PPI network
[86]:
bp_293t_df = getBioPlex('293T', '3.0')
Obtain core CORUM complexes for Human
[87]:
Corum_DF = getCorum()
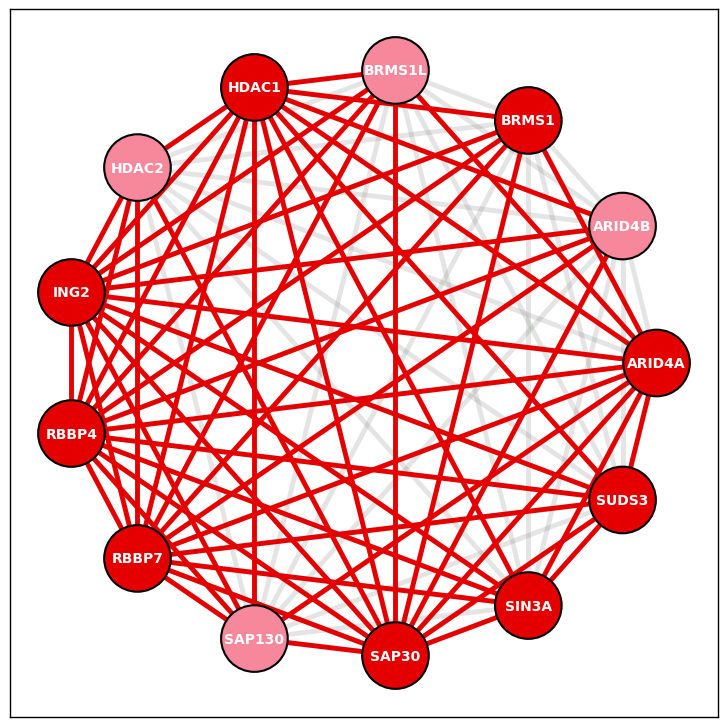
Visualize network for specified protein complex using PPI data (ING2 complex ID: 2851)
ING2 complex from HEK293T cell line PPI data version 3.0
[88]:
Corum_DF[Corum_DF.complex_name == 'ING2 complex']
[88]:
| complex_id | complex_name | synonyms | organism | cell_line | pmid | comment_complex | comment_members | comment_disease | comment_drug | ... | functions_go_name | functions_go_ontology | fcgs_description | fcgs_id | fcgs_name | fcgs_category_id | fcgs_category_name | fcgs_go_id | fcgs_go_name | fcgs_go_ontology | |
|---|---|---|---|---|---|---|---|---|---|---|---|---|---|---|---|---|---|---|---|---|---|
| 1093 | 2851 | ING2 complex | NaN | Human | HeLa S3 cells | 16387653 | ING2 is in an HDAC complex similar to ING1.ING... | NaN | NaN | NaN | ... | mitotic cell cycle;angiogenesis;nucleus;DNA to... | biological_process;biological_process;cellular... | NaN | NaN | NaN | NaN | NaN | NaN | NaN | NaN |
1 rows × 34 columns
[89]:
fig, ax = plt.subplots()

ING2_node_layout = display_PPI_network_for_complex(ax, bp_293t_df, Corum_DF, 2851, 2300, 3.5)

fig = plt.gcf()
fig.set_size_inches(7.5, 7.5)
fig.tight_layout()


# save figure as PNG plt.savefig(fig_out_path, bbox_inches='tight', dpi = 300 , transparent = True)
plt.show()
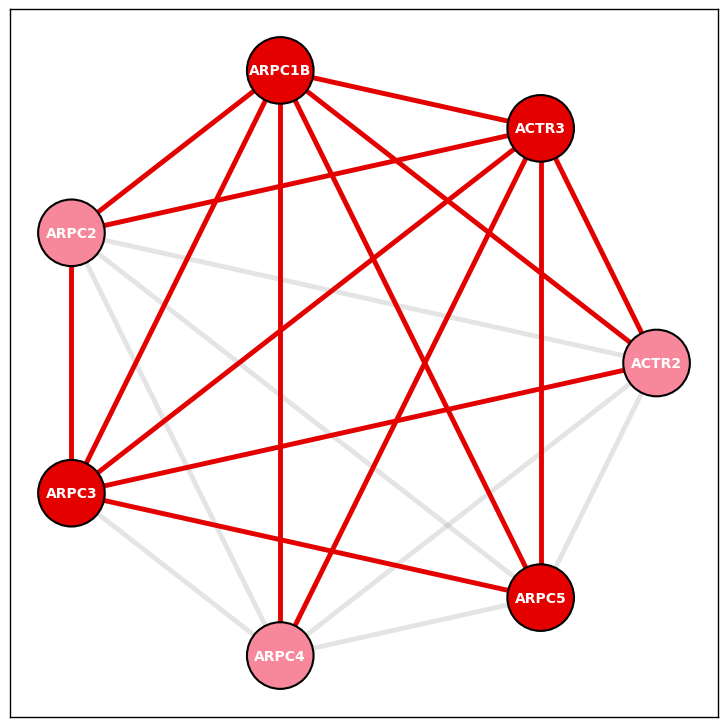
Example 2
Arp2/3 complex from HEK293T cell line PPI data version 3.0
[90]:
Corum_DF[Corum_DF.complex_name == 'Arp2/3 protein complex']
[90]:
| complex_id | complex_name | synonyms | organism | cell_line | pmid | comment_complex | comment_members | comment_disease | comment_drug | ... | functions_go_name | functions_go_ontology | fcgs_description | fcgs_id | fcgs_name | fcgs_category_id | fcgs_category_name | fcgs_go_id | fcgs_go_name | fcgs_go_ontology | |
|---|---|---|---|---|---|---|---|---|---|---|---|---|---|---|---|---|---|---|---|---|---|
| 10 | 27 | Arp2/3 protein complex | ARP2/3 protein complex | Human | Neutrophils | 9359840 | NaN | NaN | Transcript levels of ARP2/3 complex subunits, ... | NaN | ... | Arp2/3 protein complex;regulation of actin fil... | cellular_component;biological_process | NaN | NaN | NaN | NaN | NaN | NaN | NaN | NaN |
1 rows × 34 columns
[91]:
fig, ax = plt.subplots()

Arp23_node_layout = display_PPI_network_for_complex(ax, bp_293t_df, Corum_DF, 27, 2300, 3.5)

fig = plt.gcf()
fig.set_size_inches(7.5, 7.5)
fig.tight_layout()

#plt.savefig(fig_out_path, bbox_inches='tight', dpi = 300 , transparent = True)
plt.show()
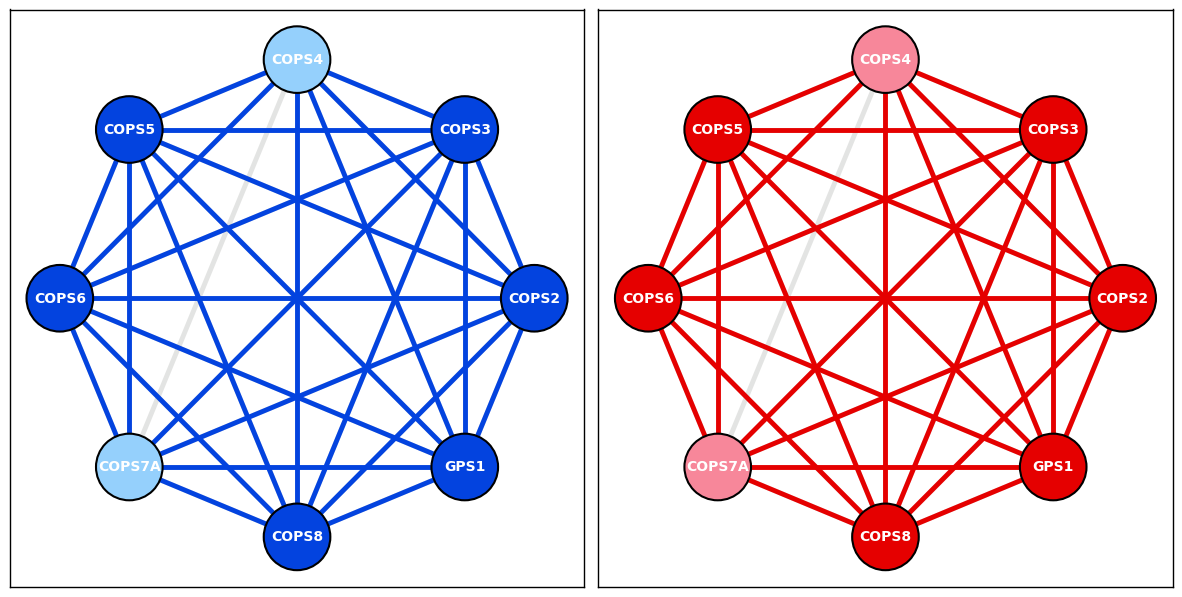
Example 3
[92]:
from matplotlib import gridspec
COP9 Signalsome complex from HCT116 cell line PPI data version 1.0 & HEK293T cell line PPI data version 3.0
[93]:
Corum_DF[Corum_DF.complex_name == 'COP9 signalosome complex']
[93]:
| complex_id | complex_name | synonyms | organism | cell_line | pmid | comment_complex | comment_members | comment_disease | comment_drug | ... | functions_go_name | functions_go_ontology | fcgs_description | fcgs_id | fcgs_name | fcgs_category_id | fcgs_category_name | fcgs_go_id | fcgs_go_name | fcgs_go_ontology | |
|---|---|---|---|---|---|---|---|---|---|---|---|---|---|---|---|---|---|---|---|---|---|
| 802 | 2174 | COP9 signalosome complex | JAB1-containing signalosome (GPS1, COPS2, COPS... | Human | HeLa cells; human JU77 mesothelioma cells | 9535219 | The purified complex is very similar, if not i... | Since the authors did not specify COP7, we use... | NaN | NaN | ... | COP9 signalosome;COP9 signalosome assembly | cellular_component;biological_process | NaN | NaN | NaN | NaN | NaN | NaN | NaN | NaN |
1 rows × 34 columns
[94]:
fig = plt.figure(constrained_layout=True)
spec = gridspec.GridSpec(ncols=2, nrows=1, figure=fig) # define 2 columns since we'll have two networks
spec.update(wspace=0.025) # set the spacing between axes.

# HCT116 1.0
ax_HCT116_v1 = fig.add_subplot(spec[0]) # create axes object for HCT116 v1 network
bp_HCT116_v1_PPI_df = getBioPlex('HCT116', '1.0') # load PPI data for HCT116 v1
COP9_node_layout = display_PPI_network_for_complex(ax_HCT116_v1, bp_HCT116_v1_PPI_df, Corum_DF, 2174, 2300, 3.5, bait_node_color='xkcd:blue', prey_node_color='xkcd:light blue', AP_MS_edge_color='xkcd:blue')

# HEK293T 3.0
ax_293T_v3 = fig.add_subplot(spec[1]) # create axes object for HEK293T v3 network
bp_293T_v3_df = getBioPlex('293T', '3.0') # load PPI data for HEK293T v3
COP9_node_layout = display_PPI_network_for_complex(ax_293T_v3, bp_293T_v3_df, Corum_DF, 2174, 2300, 3.5, node_pos=COP9_node_layout)

fig = plt.gcf()
fig.set_size_inches(15, 7.5)
fig.tight_layout()

#plt.savefig(fig_out_path, bbox_inches='tight', dpi = 300 , transparent = True)
plt.show()
Example 4
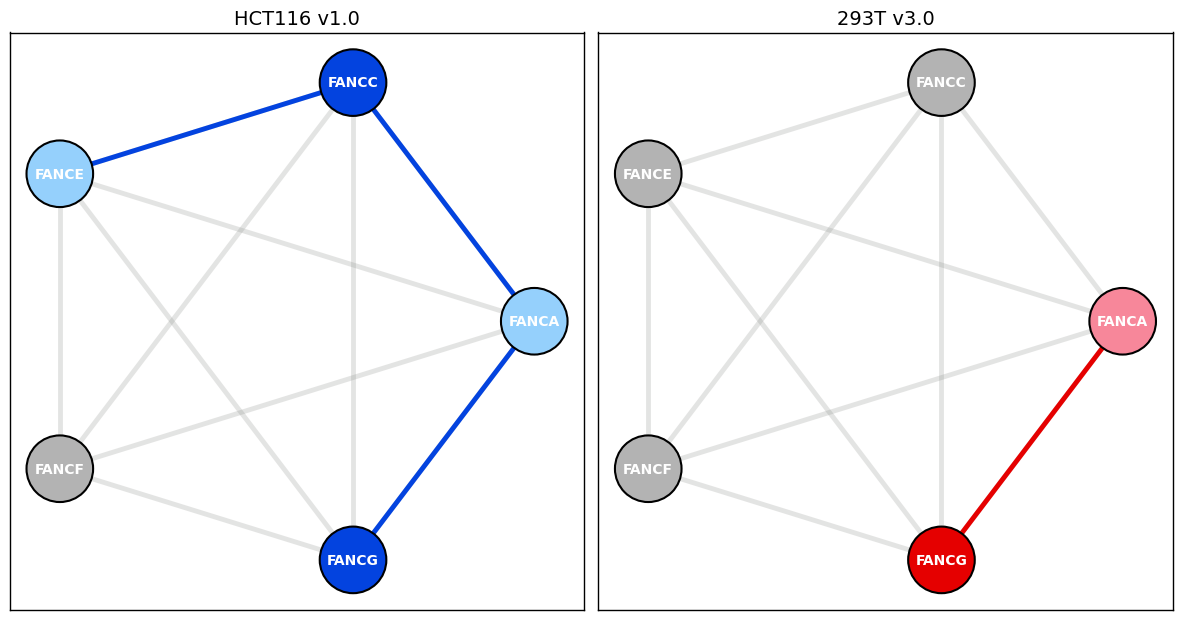
Fanconi Anemia Core complex from HCT116 cell line PPI data version 1.0 & HEK293T cell line PPI data version 3.0
[95]:
Corum_DF[Corum_DF.complex_name == 'FA core complex 1']
[95]:
| complex_id | complex_name | synonyms | organism | cell_line | pmid | comment_complex | comment_members | comment_disease | comment_drug | ... | functions_go_name | functions_go_ontology | fcgs_description | fcgs_id | fcgs_name | fcgs_category_id | fcgs_category_name | fcgs_go_id | fcgs_go_name | fcgs_go_ontology | |
|---|---|---|---|---|---|---|---|---|---|---|---|---|---|---|---|---|---|---|---|---|---|
| 683 | 1623 | FA core complex 1 | Fanconi anemia core complex 1 | Human | NaN | 12093742 | FANCE functions to target cytoplasmic FANCC to... | NaN | FA complex is involved in Fanconi anemia (FA) ... | NaN | ... | nucleus;DNA damage response;protein ubiquitina... | cellular_component;biological_process;biologic... | NaN | NaN | NaN | NaN | NaN | NaN | NaN | NaN |
1 rows × 34 columns
[96]:
fig = plt.figure(constrained_layout=True)
spec = gridspec.GridSpec(ncols=2, nrows=1, figure=fig) # define 2 columns since we'll have two networks
spec.update(wspace=0.025) # set the spacing between axes.

# HCT116 1.0
ax_HCT116_v1 = fig.add_subplot(spec[0]) # create axes object for HCT116 v1 network
bp_HCT116_v1_PPI_df = getBioPlex('HCT116', '1.0') # load PPI data for HCT116 v1
Fanconi_Anemia_node_layout = display_PPI_network_for_complex(ax_HCT116_v1, bp_HCT116_v1_PPI_df, Corum_DF, 1623, 2300, 3.5, bait_node_color='xkcd:blue', prey_node_color='xkcd:light blue', AP_MS_edge_color='xkcd:blue')
ax_HCT116_v1.set_title('HCT116 v1.0', color = 'black', fontsize = 14) # set title

# HEK293T 3.0
ax_293T_v3 = fig.add_subplot(spec[1]) # create axes object for HEK293T v3 network
bp_293T_v3_df = getBioPlex('293T', '3.0') # load PPI data for HEK293T v3
Fanconi_Anemia_node_layout = display_PPI_network_for_complex(ax_293T_v3, bp_293T_v3_df, Corum_DF, 1623, 2300, 3.5, node_pos = Fanconi_Anemia_node_layout)
ax_293T_v3.set_title('293T v3.0', color = 'black', fontsize = 14) # set title

fig = plt.gcf()
fig.set_size_inches(15, 7.5)
fig.tight_layout()

# save figure as PNG
#plt.savefig(fig_out_path, bbox_inches='tight', dpi = 300 , transparent = True)
plt.show()
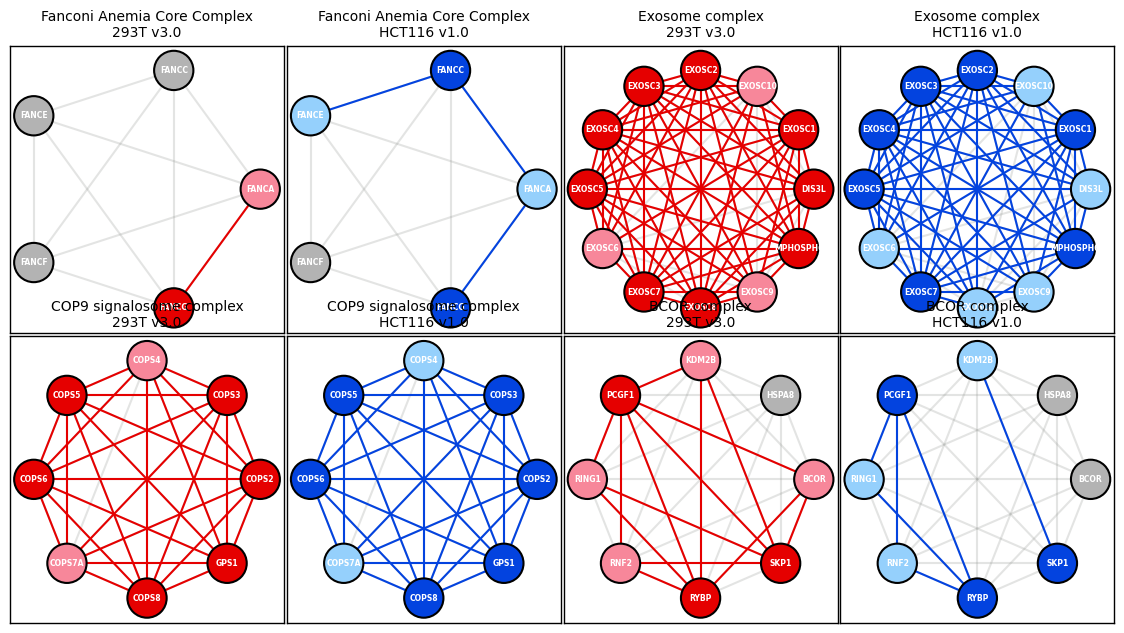
Example 5 - Recreate Figure 1 from Cell 2021 BioPlex 3.0 paper
Exosome complex
[97]:
Corum_DF[Corum_DF.complex_id == 7443]
[97]:
| complex_id | complex_name | synonyms | organism | cell_line | pmid | comment_complex | comment_members | comment_disease | comment_drug | ... | functions_go_name | functions_go_ontology | fcgs_description | fcgs_id | fcgs_name | fcgs_category_id | fcgs_category_name | fcgs_go_id | fcgs_go_name | fcgs_go_ontology | |
|---|---|---|---|---|---|---|---|---|---|---|---|---|---|---|---|---|---|---|---|---|---|
| 2626 | 7443 | Exosome | NaN | Human | HeLa cells | 20531389 | NaN | NaN | NaN | NaN | ... | RNA exonuclease activity;cytoplasm;RNA catabol... | molecular_function;cellular_component;biologic... | NaN | NaN | NaN | NaN | NaN | NaN | NaN | NaN |
1 rows × 34 columns
BCOR complex
[98]:
Corum_DF[Corum_DF.complex_id == 1178]
[98]:
| complex_id | complex_name | synonyms | organism | cell_line | pmid | comment_complex | comment_members | comment_disease | comment_drug | ... | functions_go_name | functions_go_ontology | fcgs_description | fcgs_id | fcgs_name | fcgs_category_id | fcgs_category_name | fcgs_go_id | fcgs_go_name | fcgs_go_ontology | |
|---|---|---|---|---|---|---|---|---|---|---|---|---|---|---|---|---|---|---|---|---|---|
| 555 | 1178 | BCOR complex | Ubiquitin E3 ligase | Human | NaN | 16943429 | Ubiquitin E3 ligases covalently attach ubiquit... | NaN | NaN | NaN | ... | nucleus;DNA-templated transcription;ubiquitin-... | cellular_component;biological_process;biologic... | NaN | NaN | NaN | NaN | NaN | NaN | NaN | NaN |
1 rows × 34 columns
[99]:
fig = plt.figure(constrained_layout=True)
spec = gridspec.GridSpec(ncols=4, nrows=2, figure=fig) # define 2 columns since we'll have two networks
spec.update(wspace=0.01,hspace=0.01) # set the spacing between axes.

# HEK293T 3.0 - create axes objects for HEK293T v3 network
ax_293T_v3_A = fig.add_subplot(spec[0,0])
ax_293T_v3_C = fig.add_subplot(spec[0,2])
ax_293T_v3_E = fig.add_subplot(spec[1,0])
ax_293T_v3_G = fig.add_subplot(spec[1,2])

bp_293T_v3_df = getBioPlex('293T', '3.0') # load PPI data for HEK293T v3

Fanconi_Anemia_node_layout = display_PPI_network_for_complex(ax_293T_v3_A, bp_293T_v3_df, Corum_DF, 1623, 800, 1.5, node_font_size=5.5)
Exosome_node_layout = display_PPI_network_for_complex(ax_293T_v3_C, bp_293T_v3_df, Corum_DF, 7443, 800, 1.5, node_font_size=5.5)
COP9_node_layout = display_PPI_network_for_complex(ax_293T_v3_E, bp_293T_v3_df, Corum_DF, 2174, 800, 1.5, node_font_size=5.5)
BCOR_node_layout = display_PPI_network_for_complex(ax_293T_v3_G, bp_293T_v3_df, Corum_DF, 1178, 800, 1.5, node_font_size=5.5)

# set titles
ax_293T_v3_A.set_title('Fanconi Anemia Core Complex\n293T v3.0', color = 'black', fontsize = 10)
ax_293T_v3_C.set_title('Exosome complex\n293T v3.0', color = 'black', fontsize = 10)
ax_293T_v3_E.set_title('COP9 signalosome complex\n293T v3.0', color = 'black', fontsize = 10)
ax_293T_v3_G.set_title('BCOR complex\n293T v3.0', color = 'black', fontsize = 10)

# HCT116 1.0 - create axes object for HCT116 v1 network
ax_HCT116_v1_B = fig.add_subplot(spec[0,1])
ax_HCT116_v1_D = fig.add_subplot(spec[0,3])
ax_HCT116_v1_F = fig.add_subplot(spec[1,1])
ax_HCT116_v1_H = fig.add_subplot(spec[1,3])

bp_HCT116_v1_df = getBioPlex('HCT116', '1.0') # load PPI data for HCT116 v1

Fanconi_Anemia_node_layout = display_PPI_network_for_complex(ax_HCT116_v1_B, bp_HCT116_v1_df, Corum_DF, 1623, 800, 1.5, node_font_size=5.5, bait_node_color='xkcd:blue', prey_node_color='xkcd:light blue', AP_MS_edge_color='xkcd:blue', node_pos=Fanconi_Anemia_node_layout)
Exosome_node_layout = display_PPI_network_for_complex(ax_HCT116_v1_D, bp_HCT116_v1_df, Corum_DF, 7443, 800, 1.5, node_font_size=5.5, bait_node_color='xkcd:blue', prey_node_color='xkcd:light blue', AP_MS_edge_color='xkcd:blue', node_pos=Exosome_node_layout)
COP9_node_layout = display_PPI_network_for_complex(ax_HCT116_v1_F, bp_HCT116_v1_df, Corum_DF, 2174, 800, 1.5, node_font_size=5.5, bait_node_color='xkcd:blue', prey_node_color='xkcd:light blue', AP_MS_edge_color='xkcd:blue', node_pos=COP9_node_layout)
BCOR_node_layout = display_PPI_network_for_complex(ax_HCT116_v1_H, bp_HCT116_v1_df, Corum_DF, 1178, 800, 1.5, node_font_size=5.5, bait_node_color='xkcd:blue', prey_node_color='xkcd:light blue', AP_MS_edge_color='xkcd:blue', node_pos=BCOR_node_layout)

# set titles
ax_HCT116_v1_B.set_title('Fanconi Anemia Core Complex\nHCT116 v1.0', color = 'black', fontsize = 10)
ax_HCT116_v1_D.set_title('Exosome complex\nHCT116 v1.0', color = 'black', fontsize = 10)
ax_HCT116_v1_F.set_title('COP9 signalosome complex\nHCT116 v1.0', color = 'black', fontsize = 10)
ax_HCT116_v1_H.set_title('BCOR complex\nHCT116 v1.0', color = 'black', fontsize = 10)

fig = plt.gcf()
fig.set_size_inches(14.25, 7.5)
fig.tight_layout()

# save figure as PNG
#plt.savefig(fig_out_path, bbox_inches='tight', dpi = 300 , transparent = False)
plt.show()
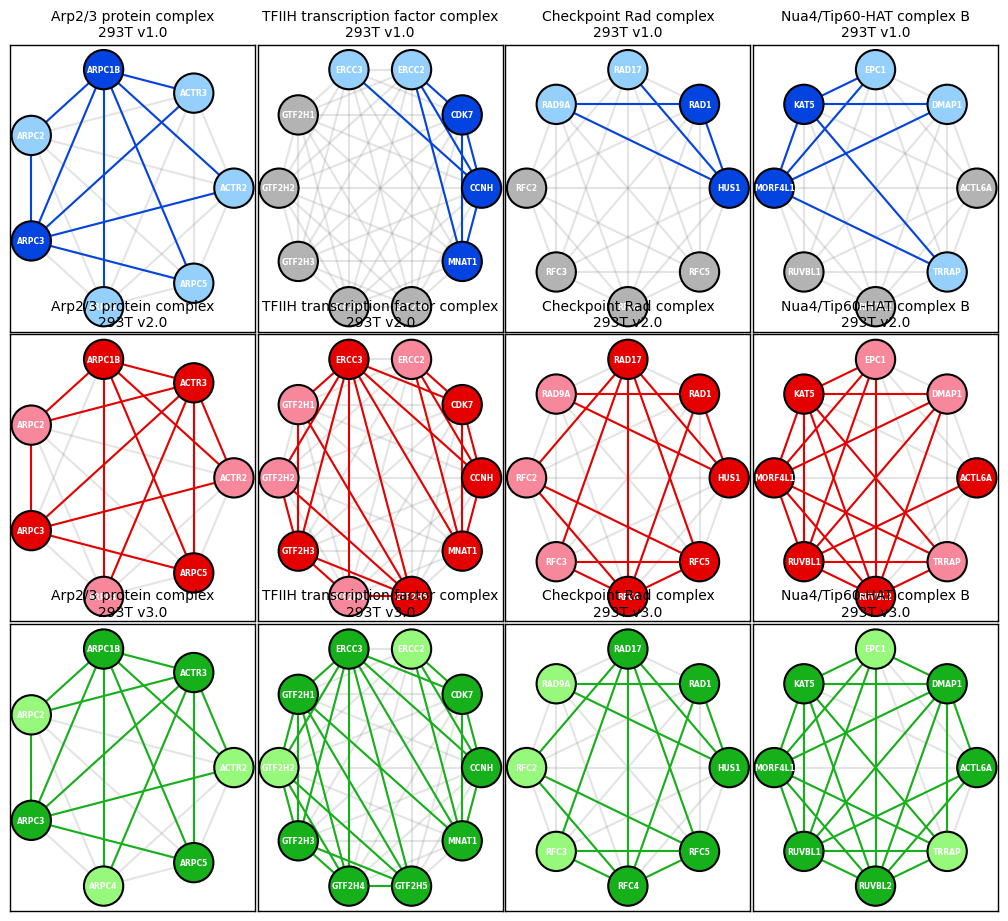
Example 6 - Recreate Figure 2 from Nature 2017 BioPlex 2.0 paper & include HEK293 v3 PPI data
Arp2/3 complex
[100]:
Corum_DF[Corum_DF.complex_id == 27]
[100]:
| complex_id | complex_name | synonyms | organism | cell_line | pmid | comment_complex | comment_members | comment_disease | comment_drug | ... | functions_go_name | functions_go_ontology | fcgs_description | fcgs_id | fcgs_name | fcgs_category_id | fcgs_category_name | fcgs_go_id | fcgs_go_name | fcgs_go_ontology | |
|---|---|---|---|---|---|---|---|---|---|---|---|---|---|---|---|---|---|---|---|---|---|
| 10 | 27 | Arp2/3 protein complex | ARP2/3 protein complex | Human | Neutrophils | 9359840 | NaN | NaN | Transcript levels of ARP2/3 complex subunits, ... | NaN | ... | Arp2/3 protein complex;regulation of actin fil... | cellular_component;biological_process | NaN | NaN | NaN | NaN | NaN | NaN | NaN | NaN |
1 rows × 34 columns
TFIIH transcription factor complex
[101]:
Corum_DF[Corum_DF.complex_id == 1029]
[101]:
| complex_id | complex_name | synonyms | organism | cell_line | pmid | comment_complex | comment_members | comment_disease | comment_drug | ... | functions_go_name | functions_go_ontology | fcgs_description | fcgs_id | fcgs_name | fcgs_category_id | fcgs_category_name | fcgs_go_id | fcgs_go_name | fcgs_go_ontology | |
|---|---|---|---|---|---|---|---|---|---|---|---|---|---|---|---|---|---|---|---|---|---|
| 459 | 1029 | TFIIH transcription factor complex | NaN | Human | HeLa cells | 8692842 | Transcription factor IIH (TFIIH) is a multisub... | NaN | NaN | NaN | ... | nucleus;DNA repair;regulation of DNA-templated... | cellular_component;biological_process;biologic... | NaN | NaN | NaN | NaN | NaN | NaN | NaN | NaN |
1 rows × 34 columns
Checkpoint RAD complex
[102]:
Corum_DF[Corum_DF.complex_id == 274]
[102]:
| complex_id | complex_name | synonyms | organism | cell_line | pmid | comment_complex | comment_members | comment_disease | comment_drug | ... | functions_go_name | functions_go_ontology | fcgs_description | fcgs_id | fcgs_name | fcgs_category_id | fcgs_category_name | fcgs_go_id | fcgs_go_name | fcgs_go_ontology | |
|---|---|---|---|---|---|---|---|---|---|---|---|---|---|---|---|---|---|---|---|---|---|
| 119 | 274 | 9-1-1-RAD17-RFC complex | RAD17-RFC-9-1-1 checkpoint supercomplex | Human | in vitro, human cells expressed in H5 cells | 12578958 | Rad17-RFC complex binds to nicked circular, ga... | NaN | NaN | NaN | ... | DNA damage checkpoint signaling;DNA binding;DN... | biological_process;molecular_function;biologic... | NaN | NaN | NaN | NaN | NaN | NaN | NaN | NaN |
1 rows × 34 columns
Nau4/Tip60-HAT complex B
[103]:
Corum_DF[Corum_DF.complex_id == 787]
[103]:
| complex_id | complex_name | synonyms | organism | cell_line | pmid | comment_complex | comment_members | comment_disease | comment_drug | ... | functions_go_name | functions_go_ontology | fcgs_description | fcgs_id | fcgs_name | fcgs_category_id | fcgs_category_name | fcgs_go_id | fcgs_go_name | fcgs_go_ontology | |
|---|---|---|---|---|---|---|---|---|---|---|---|---|---|---|---|---|---|---|---|---|---|
| 358 | 787 | NuA4/Tip60-HAT complex B | NaN | Human | NaN | 14966270 | The NuA4 histone acetyltransferase (HAT) multi... | NaN | NaN | NaN | ... | DNA binding;histone acetyltransferase activity... | molecular_function;molecular_function;cellular... | NaN | NaN | NaN | NaN | NaN | NaN | NaN | NaN |
1 rows × 34 columns
[104]:
fig = plt.figure(constrained_layout=True)
spec = gridspec.GridSpec(ncols=4, nrows=3, figure=fig)
spec.update(wspace=0.01,hspace=0.01) # set the spacing between axes.

# HEK293T 1.0 - create axes objects for HEK293T v1 network
ax_293T_v1_A = fig.add_subplot(spec[0,0])
ax_293T_v1_B = fig.add_subplot(spec[0,1])
ax_293T_v1_C = fig.add_subplot(spec[0,2])
ax_293T_v1_D = fig.add_subplot(spec[0,3])

bp_293T_v1_df = getBioPlex('293T', '1.0') # load PPI data for HEK293T v1

Arp23_node_layout = display_PPI_network_for_complex(ax_293T_v1_A, bp_293T_v1_df, Corum_DF, 27, 800, 1.5, node_font_size=5.5, bait_node_color='xkcd:blue', prey_node_color='xkcd:light blue', AP_MS_edge_color='xkcd:blue')
TFIIH_node_layout = display_PPI_network_for_complex(ax_293T_v1_B, bp_293T_v1_df, Corum_DF, 1029, 800, 1.5, node_font_size=5.5, bait_node_color='xkcd:blue', prey_node_color='xkcd:light blue', AP_MS_edge_color='xkcd:blue')
RAD_node_layout = display_PPI_network_for_complex(ax_293T_v1_C, bp_293T_v1_df, Corum_DF, 274, 800, 1.5, node_font_size=5.5, bait_node_color='xkcd:blue', prey_node_color='xkcd:light blue', AP_MS_edge_color='xkcd:blue')
NuA4_Tip60_node_layout = display_PPI_network_for_complex(ax_293T_v1_D, bp_293T_v1_df, Corum_DF, 787, 800, 1.5, node_font_size=5.5, bait_node_color='xkcd:blue', prey_node_color='xkcd:light blue', AP_MS_edge_color='xkcd:blue')

# set titles
ax_293T_v1_A.set_title('Arp2/3 protein complex\n293T v1.0', color = 'black', fontsize = 10)
ax_293T_v1_B.set_title('TFIIH transcription factor complex\n293T v1.0', color = 'black', fontsize = 10)
ax_293T_v1_C.set_title('Checkpoint Rad complex\n293T v1.0', color = 'black', fontsize = 10)
ax_293T_v1_D.set_title('Nua4/Tip60-HAT complex B\n293T v1.0', color = 'black', fontsize = 10)

# HEK293T 2.0 - create axes objects for HEK293T v2 network
ax_293T_v2_E = fig.add_subplot(spec[1,0])
ax_293T_v2_F = fig.add_subplot(spec[1,1])
ax_293T_v2_G = fig.add_subplot(spec[1,2])
ax_293T_v2_H = fig.add_subplot(spec[1,3])

bp_293T_v2_df = getBioPlex('293T', '2.0') # load PPI data for HEK293T v2

Arp23_node_layout = display_PPI_network_for_complex(ax_293T_v2_E, bp_293T_v2_df, Corum_DF, 27, 800, 1.5, node_font_size=5.5, node_pos=Arp23_node_layout)
TFIIH_node_layout = display_PPI_network_for_complex(ax_293T_v2_F, bp_293T_v2_df, Corum_DF, 1029, 800, 1.5, node_font_size=5.5, node_pos=TFIIH_node_layout)
RAD_node_layout = display_PPI_network_for_complex(ax_293T_v2_G, bp_293T_v2_df, Corum_DF, 274, 800, 1.5, node_font_size=5.5, node_pos=RAD_node_layout)
NuA4_Tip60_node_layout = display_PPI_network_for_complex(ax_293T_v2_H, bp_293T_v2_df, Corum_DF, 787, 800, 1.5, node_font_size=5.5, node_pos=NuA4_Tip60_node_layout)

# set titles
ax_293T_v2_E.set_title('Arp2/3 protein complex\n293T v2.0', color = 'black', fontsize = 10)
ax_293T_v2_F.set_title('TFIIH transcription factor complex\n293T v2.0', color = 'black', fontsize = 10)
ax_293T_v2_G.set_title('Checkpoint Rad complex\n293T v2.0', color = 'black', fontsize = 10)
ax_293T_v2_H.set_title('Nua4/Tip60-HAT complex B\n293T v2.0', color = 'black', fontsize = 10)

# HEK293T 3.0 - create axes objects for HEK293T v3 network
ax_293T_v3_I = fig.add_subplot(spec[2,0])
ax_293T_v3_J = fig.add_subplot(spec[2,1])
ax_293T_v3_K = fig.add_subplot(spec[2,2])
ax_293T_v3_L = fig.add_subplot(spec[2,3])

bp_293T_v3_df = getBioPlex('293T', '3.0') # load PPI data for HEK293T v3

Arp23_node_layout = display_PPI_network_for_complex(ax_293T_v3_I, bp_293T_v3_df, Corum_DF, 27, 800, 1.5, node_font_size=5.5, bait_node_color='xkcd:green', prey_node_color='xkcd:light green', AP_MS_edge_color='xkcd:green', node_pos=Arp23_node_layout)
TFIIH_node_layout = display_PPI_network_for_complex(ax_293T_v3_J, bp_293T_v3_df, Corum_DF, 1029, 800, 1.5, node_font_size=5.5, bait_node_color='xkcd:green', prey_node_color='xkcd:light green', AP_MS_edge_color='xkcd:green', node_pos=TFIIH_node_layout)
RAD_node_layout = display_PPI_network_for_complex(ax_293T_v3_K, bp_293T_v3_df, Corum_DF, 274, 800, 1.5, node_font_size=5.5, bait_node_color='xkcd:green', prey_node_color='xkcd:light green', AP_MS_edge_color='xkcd:green', node_pos=RAD_node_layout)
NuA4_Tip60_node_layout = display_PPI_network_for_complex(ax_293T_v3_L, bp_293T_v3_df, Corum_DF, 787, 800, 1.5, node_font_size=5.5, bait_node_color='xkcd:green', prey_node_color='xkcd:light green', AP_MS_edge_color='xkcd:green', node_pos=NuA4_Tip60_node_layout)

# set titles
ax_293T_v3_I.set_title('Arp2/3 protein complex\n293T v3.0', color = 'black', fontsize = 10)
ax_293T_v3_J.set_title('TFIIH transcription factor complex\n293T v3.0', color = 'black', fontsize = 10)
ax_293T_v3_K.set_title('Checkpoint Rad complex\n293T v3.0', color = 'black', fontsize = 10)
ax_293T_v3_L.set_title('Nua4/Tip60-HAT complex B\n293T v3.0', color = 'black', fontsize = 10)

fig = plt.gcf()
fig.set_size_inches(12.75, 11.25)
fig.tight_layout()

# save figure as PNG
#plt.savefig(fig_out_path, bbox_inches='tight', dpi = 300 , transparent = False)
plt.show()
[10] Functions to calculate and visualize physical interactions between chains of PDB structure and compare with PPI data
Example 1: Arp 2/3 complex (calling each function separately)
[1] get_UniProts_from_CORUM - function to get the set of UniProt IDs corresponding to a CORUM complex ID
Description
This function takes a CORUM complex ID and CORUM complex DataFrame and returns the corresponding UniProt IDs.
Parameters
DataFrame of CORUM complexes : Pandas DataFrame
Corum Complex ID: int
Returns
UniProt IDs
A list of UniProt IDs for the CORUM complex specified.
[105]:
Corum_DF = getCorum() # (1) Obtain CORUM complexes
UniProts_Arp_2_3 = get_UniProts_from_CORUM(Corum_DF = Corum_DF, Complex_ID = 27) # (2) Get set of UniProt IDs for specified protein complex (Arp 2/3 complex ID: 27)
[106]:
print(UniProts_Arp_2_3)
['P61160', 'P61158', 'O15143', 'O15144', 'O15145', 'P59998', 'O15511']
[2] get_PDB_from_UniProts - function to get the set of PDB IDs corresponding to a set of UniProt IDs
Description
This function takes a list of UniProt IDs and maps the corresponding UniProt IDs (from the UniProt IDs input or CORUM complex ID) to PDB IDs using the SIFTS project. Some metadata for each PDB ID is pulled from PDB and stored in a DataFrame that is returned.
Parameters
UniProt IDs : list
Returns
PDB IDs and associated metadata
Pandas DataFrame of PDB IDs that map to the UniProt IDs input, or corresponding UniProt IDs from the CORUM complex specified.
[107]:
PDB_IDs_df = get_PDB_from_UniProts(UniProts_Arp_2_3)
[108]:
PDB_IDs_df
[108]:
| num_proteins | deposit_date | citation_title | UniProts_mapped_to_PDB | num_proteins_diff_btwn_PDB_and_UniProts_input | |
|---|---|---|---|---|---|
| 6YW7 | 7 | 2020-04-29 00:00:00+00:00 | Cryo-EM of human Arp2/3 complexes provides str... | [P61160, P61158, O15144, O15145, P59998, O15511] | 0 |
| 6YW6 | 7 | 2020-04-29 00:00:00+00:00 | Cryo-EM of human Arp2/3 complexes provides str... | [P61160, P61158, O15143, O15144, O15145, P59998] | 0 |
| 6UHC | 8 | 2019-09-27 00:00:00+00:00 | Cryo-EM structure of NPF-bound human Arp2/3 co... | [P61160, P61158, O15143, O15144, O15145, P5999... | 1 |
| 9I2B | 10 | 2025-01-20 00:00:00+00:00 | Arp2/3-mediated bidirectional actin assembly b... | [P61160, P61158, O15143, O15144, O15145, P59998] | 3 |
| 8P94 | 12 | 2023-06-05 00:00:00+00:00 | Cortactin stabilizes actin branches by bridgin... | [P61160, P61158, O15143, O15144, O15145, P59998] | 5 |
[3] get_interacting_chains_from_PDB - function that takes a PDB ID and gets the chains that are physically close to eachother.
Description
This function downloads the PDB structure that is specified from the input PDB ID into the input directory, then computes the pairwise distances between all atoms for each pair of chains in the structure. A list of chain pairs that are interacting (have at least a pair of atoms < dist_threshold angstroms apart) is returned.
Parameters
PDB ID: str
directory to store PDB file: str
distance threshold: int
Returns
Interacting Chains
List of chain pairs from PDB structure that have at least one pair of atoms located < distance threshold apart.
[3] Choose a PDB ID and get the chains that are physically close to eachother.
[109]:
PDB_ID = '6YW7'
[110]:
protein_structure_dir = os.path.join(os.getcwd(),"protein_function_testing")

interacting_chains_list = get_interacting_chains_from_PDB(PDB_ID, protein_structure_dir, 6)
Downloading PDB structure '6yw7'...
[111]:
interacting_chains_list
[111]:
[['A', 'D'],
 ['A', 'E'],
 ['A', 'B'],
 ['D', 'F'],
 ['B', 'F'],
 ['B', 'G'],
 ['F', 'G'],
 ['F', 'C'],
 ['G', 'C']]
[4] chain_to_UniProt_mapping_dict - function that return a mapping from PDB chain ID -> Uniprot ID for a given PDB ID.
Description
This function retrieves PDB > UniProt mappings using the get_mappings_data() function, the parses the resulting JSON to construct a dictionary where each key is a chain from the PDB structure, and the corresponding value for each is a list of UniProt IDs that map to the chain from the SIFTS project (modified from https://github.com/PDBeurope/pdbe-api-training/blob/master/api_tutorials/5_PDB_to_UniProt_mappings_with_SIFTS.ipynb)
Parameters
pdb_id: str
Returns
Chain to UniProt Map
Dictionary of PDB ID chain to UniProt ID mappings.
[112]:
chain_to_UniProt_mapping_dict = list_uniprot_pdb_mappings(PDB_ID)
[113]:
chain_to_UniProt_mapping_dict
[113]:
{'C': ['Q92747'],
 'D': ['O15144'],
 'E': ['O15145'],
 'B': ['P61160'],
 'G': ['O15511'],
 'F': ['P59998'],
 'A': ['P61158']}
[5] PDB_chains_to_uniprot - function that takes interacting chains and chain > uniprot mapping and returns the interacting uniprot IDs.
Description
This function takes the list of interacting chains from function get_interacting_chains_from_PDB() and the chain to UniProt mappings from function list_uniprot_pdb_mappings() and returns a list of interacting chains using UniProt IDs.
Parameters
Interacting Chains: list
Chain to UniProt Map: dict
Returns
Interacting Chains
List of interacting chains using UniProt IDs.
[114]:
interacting_UniProt_IDs = PDB_chains_to_uniprot(interacting_chains_list, chain_to_UniProt_mapping_dict)
[115]:
interacting_UniProt_IDs
[115]:
[['P61158', 'O15144'],
 ['P61158', 'O15145'],
 ['P61158', 'P61160'],
 ['O15144', 'P59998'],
 ['P61160', 'P59998'],
 ['P61160', 'O15511'],
 ['P59998', 'O15511'],
 ['P59998', 'Q92747'],
 ['O15511', 'Q92747']]
[6] display_PDB_network_for_complex - function to visualize interacting chains as a network.
Description
This function displays a complete network in which nodes represent the proteins in a specified PDB structure, and edges represent chains in that structure, using NetworkX. Edges that are classified as interacting (are < 6 angstroms apart) are colored black.
Parameters
ax object to draw on: Matplotlib Axes
Mapping of Chains to UniProt IDs: dictionary
List of Interacting Chains: list
Size of Nodes in Network: int
Width of Edges in Network: float
Size of font for Node Labels: int (optional)
Returns
Node Positions
Dictionary of Node Positions in NetworkX layout
Interacting Network Edges
List of Edges for Interacting Nodes
Number of Network Edges
Float of the Number of Possible Interacting Edges
[7] display_PPI_network_match_PDB - function to visualize BioPlex PPI data as networks using interacting chains network.
Description
This function displays a complete network in which nodes represent the proteins in a specified PDB structure, and edges represent chains in that structure, using NetworkX. Edges that are classified as interacting from BioPlex PPI data (detected through AP-MS) are colored darker.
Parameters
ax object to draw on: Matplotlib Axes
Mapping of Chains to UniProt IDs: dictionary
List of Interacting Chains: list
DataFrame of PPIs : Pandas DataFrame
Networkx Position of Nodes: dict
Size of Nodes in Network: int
Width of Edges in Network: float
Size of font for Node Labels: int (optional)
Color of Nodes targeted as baits: str (optional)
Color of Nodes detected as preys only: str (optional)
Color of Edges observed via AP-MS from PPI data: str (optional)
Returns
Interacting Network Edges
List of Edges for Interacting Nodes
Number of Network Edges
Float of the Number of Possible Interacting Edges
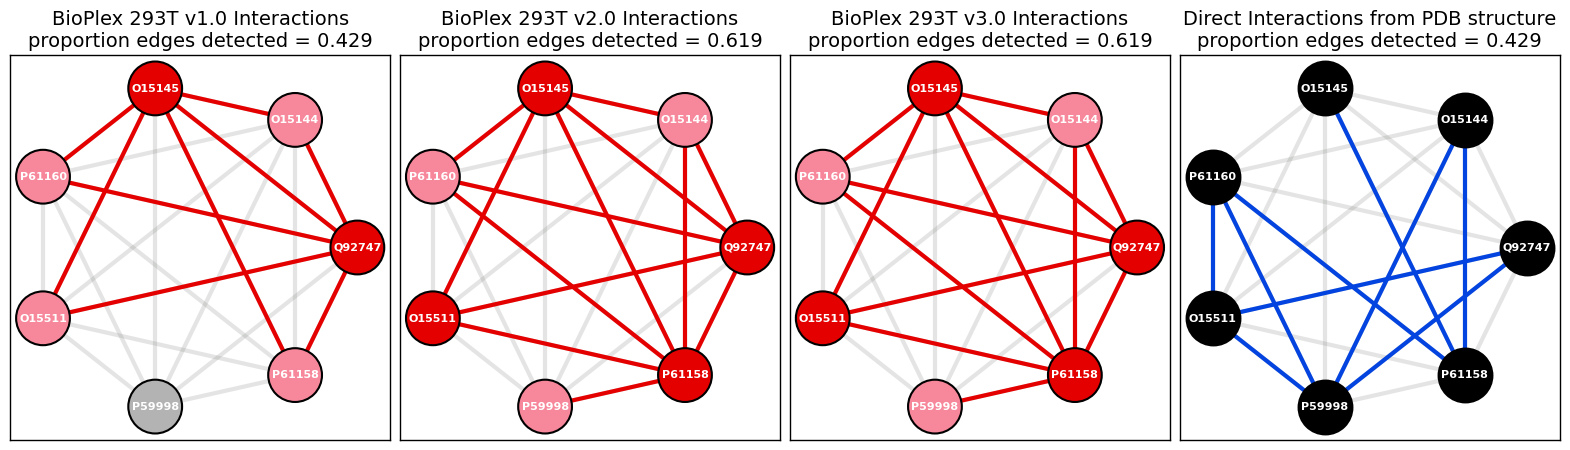
[116]:
import matplotlib.pyplot as plt
from matplotlib import gridspec

fig = plt.figure(constrained_layout=True)
spec = gridspec.GridSpec(ncols=4, nrows=1, figure=fig) # define 2 columns since we'll have two networks
spec.update(wspace=0.025) # set the spacing between axes

# chain/uniprot physical interaction network
ax4 = fig.add_subplot(spec[3])
node_layout_pdb, edges_list_pdb, num_possible_edges_pdb = display_PDB_network_for_complex(ax4, chain_to_UniProt_mapping_dict, interacting_UniProt_IDs, 1500, 3, node_font_size = 8)
prop_edges_pdb = round(float(len(edges_list_pdb)) / num_possible_edges_pdb, 3)
ax4.set_title(f'Direct Interactions from PDB structure\nproportion edges detected = {prop_edges_pdb}', color = 'black', fontsize = 14) # set title

# chain/uniprot PPI interaction networks
ax1 = fig.add_subplot(spec[0])
bp_293T_v1_df = getBioPlex('293T', '1.0') # load PPI data for HEK293T v1
edges_list_bp, num_possible_edges_bp = display_PPI_network_match_PDB(ax1, chain_to_UniProt_mapping_dict, interacting_UniProt_IDs, bp_293T_v1_df, node_layout_pdb, 1500, 3, node_font_size = 8)
prop_edges_bp = round(float(len(edges_list_bp)) / num_possible_edges_bp, 3)
ax1.set_title(f'BioPlex 293T v1.0 Interactions\nproportion edges detected = {prop_edges_bp}', color = 'black', fontsize = 14) # set title

ax2 = fig.add_subplot(spec[1])
bp_293T_v2_df = getBioPlex('293T', '2.0') # load PPI data for HEK293T v2
edges_list_bp, num_possible_edges_bp = display_PPI_network_match_PDB(ax2, chain_to_UniProt_mapping_dict, interacting_UniProt_IDs, bp_293T_v2_df, node_layout_pdb, 1500, 3, node_font_size = 8)
prop_edges_bp = round(float(len(edges_list_bp)) / num_possible_edges_bp, 3)
ax2.set_title(f'BioPlex 293T v2.0 Interactions\nproportion edges detected = {prop_edges_bp}', color = 'black', fontsize = 14) # set title

ax3 = fig.add_subplot(spec[2])
bp_293T_v3_df = getBioPlex('293T', '3.0') # load PPI data for HEK293T v3
edges_list_bp, num_possible_edges_bp = display_PPI_network_match_PDB(ax3, chain_to_UniProt_mapping_dict, interacting_UniProt_IDs, bp_293T_v3_df, node_layout_pdb, 1500, 3, node_font_size = 8)
prop_edges_bp = round(float(len(edges_list_bp)) / num_possible_edges_bp, 3)
ax3.set_title(f'BioPlex 293T v3.0 Interactions\nproportion edges detected = {prop_edges_bp}', color = 'black', fontsize = 14) # set title

fig = plt.gcf()
fig.set_size_inches(20, 5)
fig.tight_layout()

# save figure as PNG
#plt.savefig(fig_out_path, bbox_inches='tight', dpi = 300 , transparent = True)
plt.show()
Find the edges that are detected in both PDB structure network and BioPlex 293Tv3 networks.
[117]:
overlapping_edges_list = list(set(edges_list_pdb).intersection(set(edges_list_bp)))
overlapping_edges_list
[117]:
[('P61160', 'P61158'),
 ('Q92747', 'O15511'),
 ('O15145', 'P61158'),
 ('O15144', 'P61158')]
Calculate proportion of edges that are detected in both PDB structure network and BioPlex 293Tv3 networks.
[118]:
round(float(len(overlapping_edges_list)) / num_possible_edges_pdb, 3)
[118]:
0.19
Example 2: TFIIH Complex (using wrapper function)
[1] Get the set of UniProt IDs corresponding to a CORUM complex ID
[119]:
Corum_DF = getCorum() # (1) Obtain CORUM complexes
UniProts_TFIIH = get_UniProts_from_CORUM(Corum_DF = Corum_DF, Complex_ID = 107) # (2) Get set of UniProt IDs for specified protein complex (TFIIH complex ID: 107)
[120]:
print(UniProts_TFIIH)
['P51946', 'P50613', 'P18074', 'P19447', 'P32780', 'Q13888', 'Q13889', 'Q92759', 'P51948']
[2] Get the set of PDB IDs corresponding to a set of UniProt IDs
[121]:
PDB_IDs_df = get_PDB_from_UniProts(UniProts_TFIIH)
[122]:
PDB_IDs_df.head()
[122]:
| num_proteins | deposit_date | citation_title | UniProts_mapped_to_PDB | num_proteins_diff_btwn_PDB_and_UniProts_input | |
|---|---|---|---|---|---|
| 8EBY | 9 | 2022-08-31 00:00:00+00:00 | Lesion recognition by XPC, TFIIH and XPA in DN... | [P18074, P19447, P32780, Q13888, Q13889, Q92759] | 0 |
| 8EBU | 9 | 2022-08-31 00:00:00+00:00 | Lesion recognition by XPC, TFIIH and XPA in DN... | [P18074, P19447, P32780, Q13888, Q13889, Q92759] | 0 |
| 8EBW | 10 | 2022-08-31 00:00:00+00:00 | Lesion recognition by XPC, TFIIH and XPA in DN... | [P18074, P19447, P32780, Q13888, Q13889, Q92759] | 1 |
| 8EBV | 10 | 2022-08-31 00:00:00+00:00 | Lesion recognition by XPC, TFIIH and XPA in DN... | [P18074, P19447, P32780, Q13888, Q13889, Q92759] | 1 |
| 8EBT | 10 | 2022-08-31 00:00:00+00:00 | Lesion recognition by XPC, TFIIH and XPA in DN... | [P18074, P19447, P32780, Q13888, Q13889, Q92759] | 1 |
[3] PDB_to_interacting_chains_uniprot_maps - wrapper function, choose a PDB ID and get the chains that are physically close to eachother in Uniprot IDs and returns a mapping from PDB chain ID -> Uniprot ID for a given PDB ID
Description
This is a wrapper function for functions
get_interacting_chains_from_PDB()
list_uniprot_pdb_mappings()
PDB_chains_to_uniprot()
to get a list of interacting chains from PDB structure using UniProt labels and the chain-to-UniProt mapping for this PDB structure.
Parameters
PDB ID: str
directory to store PDB file: str
distance threshold: int
Returns
Chain to UniProt Map
Dictionary of PDB ID chain to UniProt ID mappings
Interacting Chains
List of interacting chains using UniProt IDs
[123]:
protein_structure_dir = os.path.join(os.getcwd(),"protein_function_testing")
chain_to_UniProt_mapping_dict, interacting_UniProt_IDs = PDB_to_interacting_chains_uniprot_maps('6NMI', protein_structure_dir, 6)
Downloading PDB structure '6nmi'...
[124]:
chain_to_UniProt_mapping_dict
[124]:
{'H': ['P51948'],
 'C': ['P32780'],
 'D': ['Q92759'],
 'E': ['Q13888'],
 'B': ['P18074'],
 'G': ['Q6ZYL4'],
 'F': ['Q13889'],
 'A': ['P19447']}
[125]:
interacting_UniProt_IDs
[125]:
[['P19447', 'P18074'],
 ['P19447', 'Q92759'],
 ['P19447', 'Q13888'],
 ['P19447', 'Q6ZYL4'],
 ['P19447', 'P51948'],
 ['P18074', 'P32780'],
 ['P18074', 'Q13888'],
 ['P18074', 'P51948'],
 ['P32780', 'Q92759'],
 ['P32780', 'Q13888'],
 ['P32780', 'Q13889'],
 ['Q92759', 'Q13889'],
 ['Q92759', 'Q6ZYL4'],
 ['Q13888', 'Q13889']]
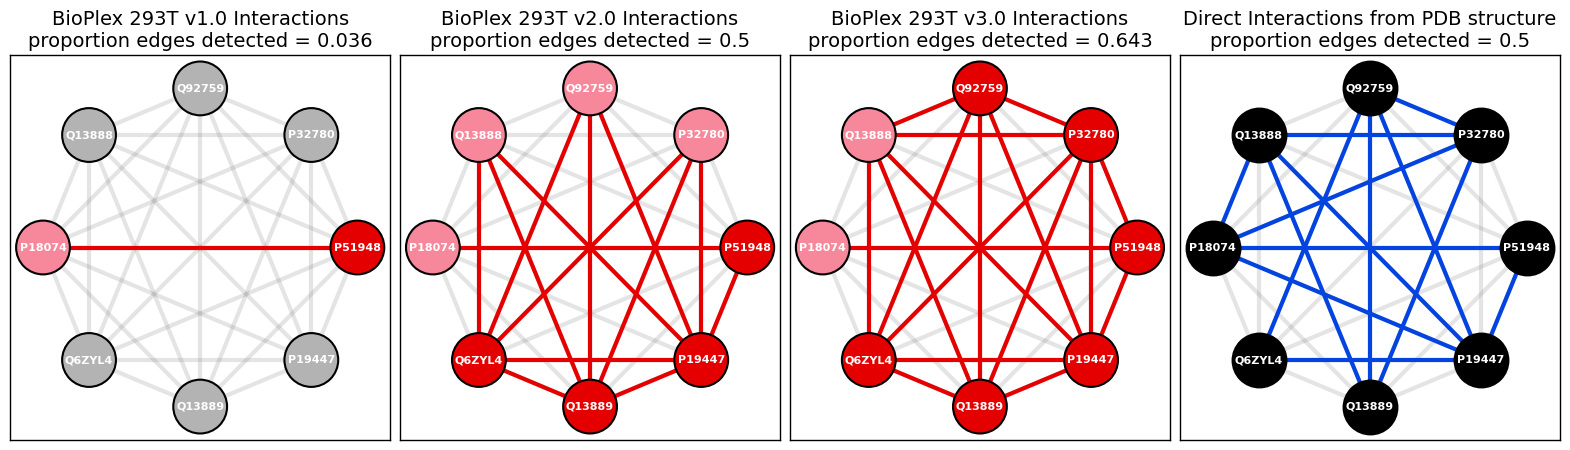
[4] Visualize interacting chains and corresponding BioPlex PPI data as networks.
[126]:
import matplotlib.pyplot as plt
from matplotlib import gridspec

fig = plt.figure(constrained_layout=True)
spec = gridspec.GridSpec(ncols=4, nrows=1, figure=fig) # define 2 columns since we'll have two networks
spec.update(wspace=0.025) # set the spacing between axes

# chain/uniprot physical interaction network
ax4 = fig.add_subplot(spec[3])
node_layout_pdb, edges_list_pdb, num_possible_edges_pdb = display_PDB_network_for_complex(ax4, chain_to_UniProt_mapping_dict, interacting_UniProt_IDs, 1500, 3, node_font_size = 8)
prop_edges_pdb = round(float(len(edges_list_pdb)) / num_possible_edges_pdb, 3)
ax4.set_title(f'Direct Interactions from PDB structure\nproportion edges detected = {prop_edges_pdb}', color = 'black', fontsize = 14) # set title

# chain/uniprot PPI interaction networks
ax1 = fig.add_subplot(spec[0])
bp_293T_v1_df = getBioPlex('293T', '1.0') # load PPI data for HEK293T v1
edges_list_bp, num_possible_edges_bp = display_PPI_network_match_PDB(ax1, chain_to_UniProt_mapping_dict, interacting_UniProt_IDs, bp_293T_v1_df, node_layout_pdb, 1500, 3, node_font_size = 8)
prop_edges_bp = round(float(len(edges_list_bp)) / num_possible_edges_bp, 3)
ax1.set_title(f'BioPlex 293T v1.0 Interactions\nproportion edges detected = {prop_edges_bp}', color = 'black', fontsize = 14) # set title

ax2 = fig.add_subplot(spec[1])
bp_293T_v2_df = getBioPlex('293T', '2.0') # load PPI data for HEK293T v2
edges_list_bp, num_possible_edges_bp = display_PPI_network_match_PDB(ax2, chain_to_UniProt_mapping_dict, interacting_UniProt_IDs, bp_293T_v2_df, node_layout_pdb, 1500, 3, node_font_size = 8)
prop_edges_bp = round(float(len(edges_list_bp)) / num_possible_edges_bp, 3)
ax2.set_title(f'BioPlex 293T v2.0 Interactions\nproportion edges detected = {prop_edges_bp}', color = 'black', fontsize = 14) # set title

ax3 = fig.add_subplot(spec[2])
bp_293T_v3_df = getBioPlex('293T', '3.0') # load PPI data for HEK293T v3
edges_list_bp, num_possible_edges_bp = display_PPI_network_match_PDB(ax3, chain_to_UniProt_mapping_dict, interacting_UniProt_IDs, bp_293T_v3_df, node_layout_pdb, 1500, 3, node_font_size = 8)
prop_edges_bp = round(float(len(edges_list_bp)) / num_possible_edges_bp, 3)
ax3.set_title(f'BioPlex 293T v3.0 Interactions\nproportion edges detected = {prop_edges_bp}', color = 'black', fontsize = 14) # set title

fig = plt.gcf()
fig.set_size_inches(20, 5)
fig.tight_layout()

# save figure as PNG
#plt.savefig(fig_out_path, bbox_inches='tight', dpi = 300 , transparent = True)
plt.show()
Find the edges that are detected in both PDB structure network and BioPlex 293Tv1-3 networks.
[127]:
overlapping_edges_list = list(set(edges_list_pdb).intersection(set(edges_list_bp)))
overlapping_edges_list
[127]:
[('Q92759', 'Q6ZYL4'),
 ('P32780', 'Q13888'),
 ('P32780', 'Q92759'),
 ('Q6ZYL4', 'P19447'),
 ('Q13888', 'P19447'),
 ('Q92759', 'Q13889'),
 ('P32780', 'Q13889'),
 ('P51948', 'P18074'),
 ('Q13888', 'Q13889'),
 ('P51948', 'P19447'),
 ('Q92759', 'P19447')]
Calculate proportion of edges that are detected in both PDB structure network and BioPlex 293Tv3 networks.
[128]:
round(float(len(overlapping_edges_list)) / num_possible_edges_pdb, 3)
[128]:
0.393